

Demand and revenue build
Revenue and Calc connect monthly order opportunities, conversion, category mix, realized prices, and launch timing to sales.


This Online Pharmacy Financial Model is an Excel template for a licensed, closed-door Texas pharmacy selling prescriptions and OTC-only orders online. It links completed-order demand, prices, fulfillment costs, staffing, startup investment, and funding to 2026–2030 monthly projections.
The example uses a leased 2,000-square-foot Dallas-area fulfillment suite and Texas-only deliveries. It assumes valid prescriptions, pharmacist review and counseling, and domestic sourcing; controlled substances, cold-chain specialty drugs, sterile compounding, telemedicine prescribing, and clinical-service fees are excluded.
The workbook links pharmacy-specific operating inputs to calculations, financial statements, funding schedules, and decision reports.
Revenue and Calc connect monthly order opportunities, conversion, category mix, realized prices, and launch timing to sales.
COGS & OPEX separates drugs, freight, variable fees, and overhead. Payroll models pharmacists, technicians, fulfillment, patient service, and management by FTE and salary.
CAPEX schedules fitout and equipment. CapTable records owner equity; Dashboard debt controls and Debt can model optional borrowing.
IS, CF, and BS cover financial statements. Dashboard, Scenarios, Returns, Sources & Uses, and Checks support decision reviews.
Monthly completed orders equal qualified ordering opportunities multiplied by the estimated 5% conversion rate, then split once across five mutually exclusive order categories.
Monthly qualified website, app, and refill opportunities grow from 70,000 in 2026 to 300,000 in 2030. Completed orders rise from 3,500 to 15,000 per month; the launch month is fully active.
Each order is one prescription fill or one OTC-only basket. Refills use the same demand pool, shipping is included once, and OTC wellness makes up the residual 8% share.
The Revenue Forecast shows demand, conversion, order mix, and realized prices feeding monthly Calc. Editing these inputs changes annual sales without counting prescription add-ons or refills twice.
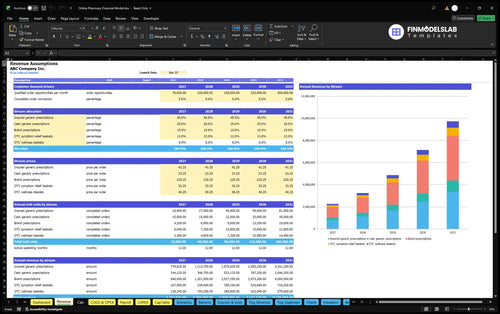
| Order category | Order mix | Price per order |
|---|---|---|
| Insured generic prescriptions | 45% | $41.25 |
| Cash generic prescriptions | 25% | $23.25 |
| Brand prescriptions | 10% | $225.25 |
| OTC symptom relief baskets | 12% | $33.25 |
| OTC wellness baskets | 8% | $40.25 |
Prices are estimated nominal USD amounts, each including shipping once; patient taxes are excluded.
70,000 opportunities per month × 5% = 3,500 completed orders per month; 3,500 × $54.11 weighted realized price × 12 months = $2,272,620 forecast revenue.
Operating expenses are separated into revenue-linked drug and fulfillment costs, revenue-linked variable overhead, monthly fixed costs, and role-based base payroll.
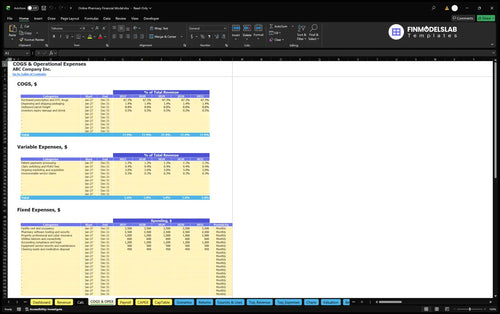
COGS covers drugs, packaging, outbound freight, and shrink. Displayed rates total approximately 77.92% of sales; the expense table retains the source outputs rather than recomputing rounded rates.
Variable expenses total 5%: processing 1.3%, switching and PSAO 0.4%, marketing 3%, and service claims 0.3%. Fixed costs cover rent, software, insurance, utilities, compliance, maintenance, and disposal; rent is estimated at $3,500 monthly.
The COGS and Operating Expenses forecast separates drug and shipping costs from variable fees and fixed overhead. It shows the impact of volume growth on gross profit and EBITDA.
| Expense category | 2026 | 2030 |
|---|---|---|
| Cost of goods sold | $1,770,743 | $7,588,899 |
| Variable operating expenses | $113,631 | $486,990 |
| Fixed operating expenses | $117,000 | $117,000 |
| Base payroll | $381,000 | $845,000 |
2026 and 2030 amounts are the source model case; COGS rates are displayed in rounded form.
The Payroll Forecast uses annual FTE and base salaries for pharmacists, technicians, fulfillment, patient service, and management. Payroll rises from $381,000 in 2026 to $845,000 in 2030.
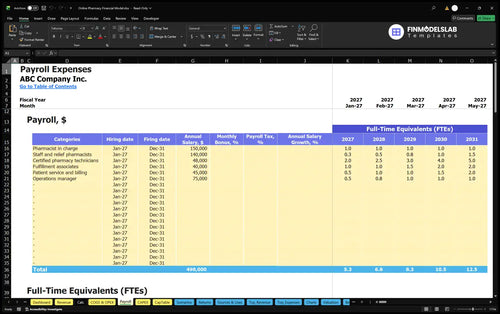
The pharmacist in charge remains at 1.0 FTE and $150,000 annually. Relief pharmacists rise from 0.25 to 1.5 FTE at $140,000 each; technicians increase from 2 to 5 FTE at $48,000.
Base salaries appear only in Payroll, not COGS or fixed costs. The illustrated EBITDA excludes employer payroll taxes and benefits.
Opening investment and working-capital requirements are modeled separately from annual operating expenses and EBITDA.
Listed assets total $138,000: pharmacy fitout $80,000, shelving $18,000, verification equipment $22,000, and IT/security $18,000. Additional monitoring and secure storage items are separate.
The CAPEX plan schedules fitout, equipment, computing, and security purchases, plus applicable depreciation. Capital investments are separate from the annual operating-expense totals.

Other opening cash covers deposits, licensing, credentialing, software integration, marketing, and training. Working capital assumes 14 receivable days, 12 payable days, and 25 inventory days.
The Sources and Uses of Funds report tracks funding against spending and cash retained. Initial owner capital is estimated at $971,414, including a three-month reserve of first-year recurring cash outflows.
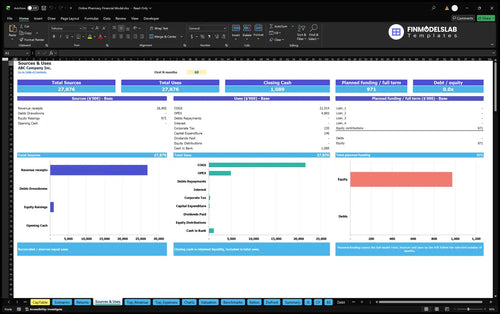
The documented base case grows annual sales as completed orders increase, with EBITDA moving from a launch-year loss to a positive modeled operating result.
| Year | Revenue | Operating expenses | EBITDA |
|---|---|---|---|
| 2026 | $2,272,620 | $2,382,374 | -$109,754 |
| 2027 | $3,246,600 | $3,290,213 | -$43,613 |
| 2028 | $4,869,900 | $4,733,945 | $135,956 |
| 2029 | $7,142,520 | $6,743,819 | $398,701 |
| 2030 | $9,739,800 | $9,037,889 | $701,911 |
Illustrative scenario results, not historical performance or industry averages; rounded to whole dollars, so some displayed rows may differ by $1.
Revenue rises from $2,272,620 in 2026 to $9,739,800 in 2030 as order opportunities increase with unchanged conversion, mix, and prices. EBITDA first becomes positive in 2028 at $135,956.
EBITDA excludes interest, taxes, depreciation, and amortization; it does not prove positive net income, liquidity, or funding sufficiency.
The Cash Flow Forecast tracks collections, operating payments, investing, and financing. Review its cash balances separately from EBITDA when assessing inventory funding and payer receivables.
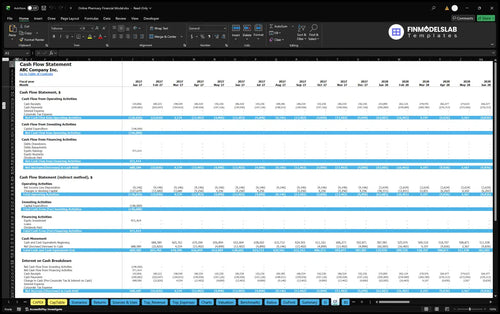
Income Statement, Balance Sheet, and Summary reporting is available; the source provides no net-profit, cash-balance, or asset-balance figures.
Returns and scenario reports support separate questions about operating coverage, liquidity timing, investment recovery, and capital efficiency.
Sales break-even tests operating cost coverage; cash break-even tests cumulative cash generation; payback tests invested-capital recovery. None follows automatically from positive EBITDA.
The Returns report analyzes sales break-even, cash break-even, investment payback, and annual ROIC. The supplied case establishes no payback date or ROIC amount.
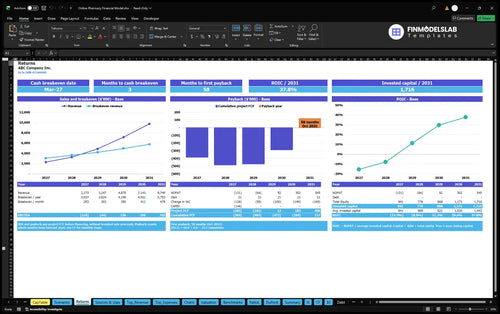
Dashboard controls apply Low, Base, and High multipliers to revenue and costs. Scenarios compares margins and EBITDA; Valuation provides DCF sensitivity without a supplied valuation result.
The model is designed for operators, buyers, and advisers assessing a specific Texas-delivery online pharmacy concept rather than a generic retail storefront.
Test traffic, conversion, order mix, prices, drug costs, or staffing. Dashboard displays selected controls, and Checks flags model inconsistencies.
Other states, pharmacy formats, reimbursement schemes, or clinical services require adjusted operating assumptions; this example covers Texas deliveries only.
These answers clarify the order engine, included operating costs, and interpretation of the projected financial reports.
Yes. Edit qualified opportunities, conversion, realized prices, and shares for the five order categories in the revenue planning inputs.
Refills belong to the same completed-order demand pool, with each order allocated once.
Yes. Each realized order price includes shipping once; outbound freight and dispensing packaging are separately modeled as direct costs.
No. Staffing is costed through Payroll, but the documented demand-based revenue formula has no editable fulfillment-capacity ceiling.
It covers startup assets, preopening costs, initial working capital, and a three-month recurring cash-outflow reserve.
No. Cash balances also depend on inventory, collections, payables, capital spending, and financing. Review the Cash Flow and Balance Sheet reports.
No. Returns supports these calculations, but the source provides no verified payback date or ROIC.
No. The illustrated scope is Texas patient deliveries of eligible prescription and OTC orders, without controlled substances, cold-chain specialty drugs, or sterile compounding.
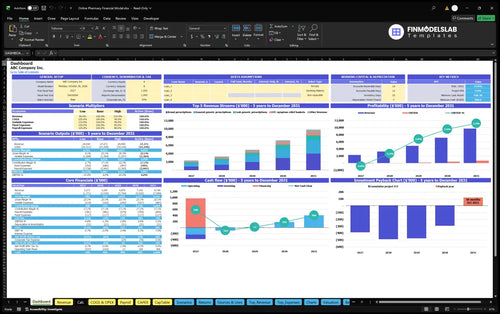
KPIs, forecasts, and cash flow at a glance.
Key assumptions and calculations driving revenue forecasts.
Funding sources, spending, and closing cash.
Cash break-even, payback, and ROIC.
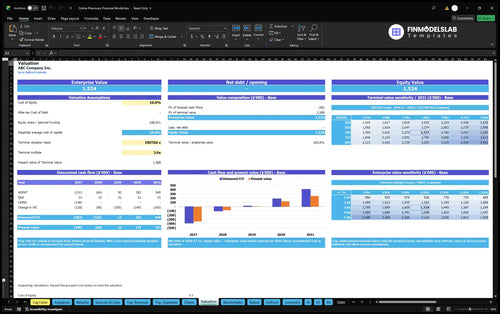
DCF valuation and sensitivity analysis.
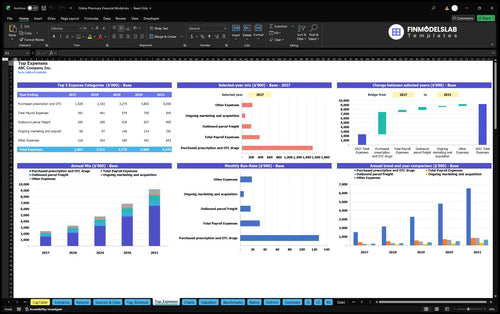
Largest costs and spending trends.

Annual and monthly financial performance.
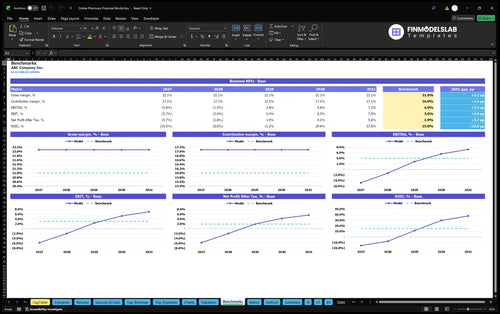
Compare margins and returns to benchmarks.

This template kept one bad formula from throwing off the whole model, which saved me hours of rechecking. I could trust the outputs and move on to planning instead of hunting for broken cells.

I didn’t have to start from scratch, so I got a working pharmacy model in minutes instead of staring at an empty spreadsheet. It made the first draft easy and saved me most of a day.
The structure showed exactly what investors would ask for, so I spent less time guessing and more time refining assumptions. We booked a review call with a clear five-year view and clean cash flow numbers.