

Revenue and Calc
Edit qualified visits, conversion rates, category order shares, prices, and launch timing; monthly calculations feed the annual sales forecast.


The Optical Store Financial Model is an Excel template for projecting monthly sales, expenses, staffing, and financial statements for an independent optical retail business. Qualified store visits and purchase conversion drive product orders, which are allocated across five eyewear and accessory categories.
The illustrative business is an owner-operated, 1,200-square-foot leased shop in Columbus, Ohio, launching January 31, 2026. It dispenses prescriptions issued elsewhere and outsources lens fabrication; the modeled scope excludes eye exams, insurer billing, in-house production, and e-commerce.
The workbook links retail operating assumptions to monthly calculations, financial statements, and investment analysis.
Edit qualified visits, conversion rates, category order shares, prices, and launch timing; monthly calculations feed the annual sales forecast.
Plan purchased products, outsourced fabrication, variable costs, monthly store overhead, and annual-average staffing by role.
Review model controls, headline results, and Low, Base, and High multipliers for revenue and operating cost categories.
Inspect the Income Statement, Cash Flow, Balance Sheet, Sources & Uses, Returns, Valuation, and supporting charts and checks.
Changes to demand, product mix, and staffing translate into updated operating results rather than independent estimates.
Adjust qualified monthly visits and purchase conversion independently to evaluate order volume and revenue.
Change the five order allocations or category prices to see how the weighted value per order shifts.
Revise optician and retail-assistant FTE assumptions and compare personnel expense with modeled EBITDA.
Monthly qualified visits multiplied by the purchase conversion rate produce orders, allocated once across five categories.
For 2026, the model assumes 650 qualified visits per month and a 28% purchase conversion rate. Visits rise to 1,000 per month and conversion to 32% by 2030; neither assumption is constrained by a separate capacity ceiling.
Order allocations are 35% single-vision glasses at $250, 25% progressives at $450, 10% prescription sunglasses at $300, and 20% contact refills at $120. The remaining 10% is assigned to $25 accessories; eyeglass prices include frames and lenses.
The Revenue Forecast connects monthly store visits, conversion rates, category order shares, and selling prices to five distinct sales streams. Annual totals reflect the same allocations used in the monthly calculations.
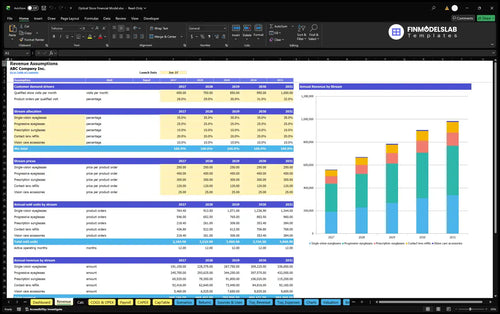
650 visits/month × 28% conversion = 182 orders/month; 182 × $256.50 weighted order value × 12 months = $560,196 annual revenue.
Revenue-linked product and transaction costs are modeled separately from monthly overhead and fixed-base staff compensation.
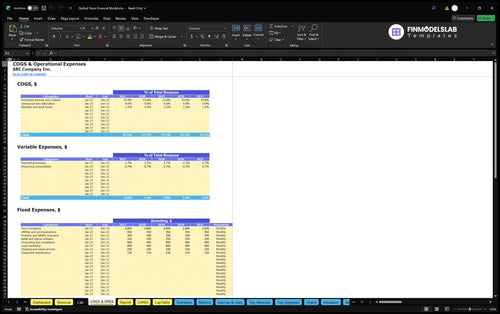
Direct costs are 33% for purchased eyewear and contacts, 9% for outsourced lens fabrication, and 1.5% for remakes and stock loss. Payment processing adds 2.7% of sales and dispensing consumables add 0.7% as variable operating expenses.
Fixed operating expenses cover occupancy, utilities, insurance, software, accounting, marketing, cleaning, and maintenance. The illustrative total is $64,800 per year, including $2,800 monthly store occupancy; staff salaries are not duplicated in these cost lines.
The COGS and Operating Expenses report separates purchased merchandise and outsourced lens costs from transaction expenses and recurring store overhead. These inputs help explain gross margin, contribution margin, and EBITDA changes.
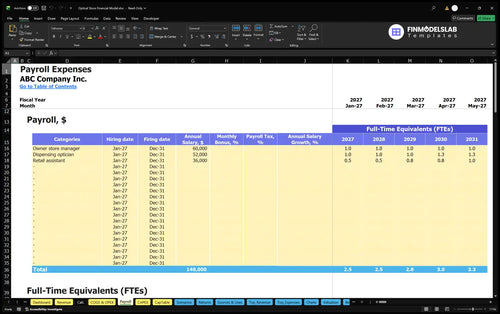
The plan begins with a full-time owner-manager at $60,000, one optician at $52,000, and a half-time retail assistant at a $36,000 full-time annual base. Optician FTE reaches 1.25 and assistant FTE reaches 1.0 by 2030.
The Payroll Forecast links staff roles, annual-average full-time equivalents, and base salaries to monthly personnel expense. The example rises from $130,000 in 2026 to $161,000 in 2030, excluding employer taxes, benefits, and personal taxes under this case scope.
Opening assets, other setup cash, working capital, and operating reserves are modeled separately from annual EBITDA.
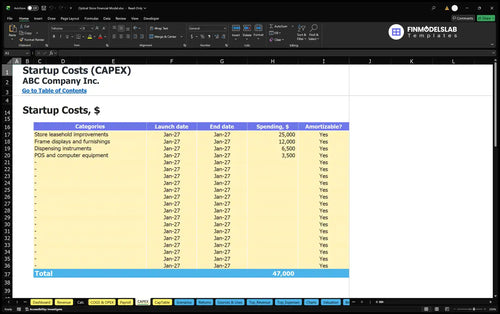
Startup assets total $47,000: $25,000 of leasehold improvements, $12,000 of frame displays and furnishings, $6,500 of dispensing instruments, and $3,500 of POS and computer equipment. Lease deposits, setup fees, and preopening promotion are additional one-time cash items.
The Capital Expenditure Plan schedules store improvements, displays, instruments, and equipment purchases, with depreciation treatment where applicable. It separates investment spending from the recurring retail operating expense forecast.
The selected working-capital inputs are 0 receivable days, 17 payable days, and 52 inventory days. They inform the opening and ongoing funding requirement without creating revenue or operating earnings.
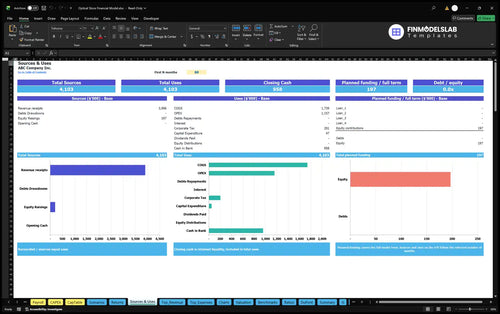
The Sources and Uses of Funds report reconciles equity and other financing sources with purchases, operating payments, and cash retained. The illustrative $196,681 initial owner funding estimate covers startup needs and a three-month operating reserve; no outside funding is committed.
These 2026–2030 Columbus optical-store projections show modeled revenue, operating expenses, and EBITDA—not observed results or industry averages.
| Year | Revenue | Operating Expenses | EBITDA |
|---|---|---|---|
| 2026 | $560,196 | $457,532 | $102,664 |
| 2027 | $669,465 | $508,779 | $160,686 |
| 2028 | $784,890 | $571,913 | $212,977 |
| 2029 | $906,471 | $641,935 | $264,536 |
| 2030 | $984,960 | $687,746 | $297,214 |
USD figures are illustrative and rounded to whole dollars; displayed figures may differ slightly from unrounded calculations.
Revenue increases as qualified visits and conversion improve while category prices and allocation shares remain fixed in this example. EBITDA grows from $102,664 in 2026 to $297,214 in 2030, after the operating expenses and fixed-base payroll shown above.
The Income Statement adds depreciation, financing costs, and taxes beyond EBITDA; those numeric outcomes are not provided in the operating brief. The Balance Sheet and model checks support review of working capital, funding balances, and reconciliations.
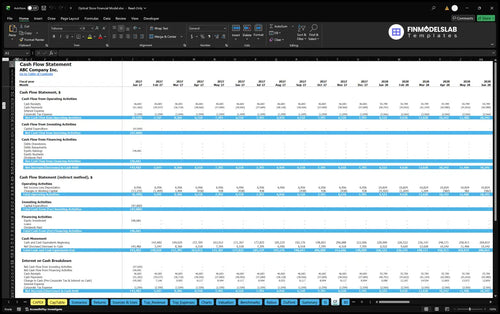
The Cash Flow Forecast tracks operating receipts and payments alongside capital expenditure, equity contributions, debt movements, and opening-to-closing cash reconciliation. Unlike EBITDA, this report is intended for reviewing liquidity and possible funding gaps.
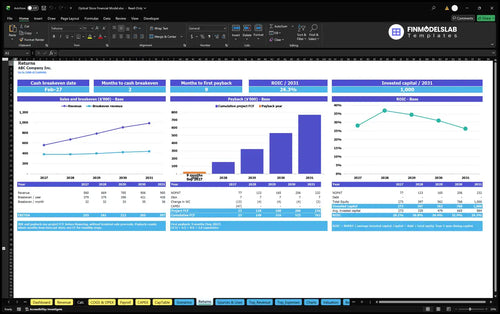
The workbook includes distinct analyses for sales break-even, cash break-even, investment recovery, and returns on invested capital.
Sales break-even compares sales with the operating costs they must cover; cash break-even depends on the timing of actual cash inflows and outflows. Investment payback tracks recovery of invested funds, while annual ROIC evaluates returns against invested capital.
Low, Base, and High scenario controls vary revenue, direct costs, variable costs, fixed costs, and payroll. Optional debt controls allow different facility terms, interest assumptions, and repayment structures; the example does not assume an approved loan.
The Returns report evaluates break-even requirements, cumulative project cash flow, investment payback, and annual return on invested capital. No specific payback date or ROIC result is asserted by the illustrative EBITDA figures.
This model fits planning for a small optical dispensing shop that purchases frames and contacts and outsources lens fabrication.
Use it to challenge traffic conversion, eyewear product mix, staffing levels, store overhead, inventory days, and startup financing. An operation offering eye exams, third-party insurance claims, laboratory fabrication, or online retail would need additional revenue and cost mechanics not established in this case.
Answers to common questions about the operating assumptions, projections, and included financial reports.
Yes. Qualified store visits and purchase conversion are separate annual assumptions driving monthly product orders without a competing capacity cap.
No. Single-vision, progressive, and prescription-sunglass prices are modeled as complete pairs, with outsourced lens fabrication included in costs.
No. The illustrative store dispenses external prescriptions and excludes exams, insurer billing, in-house lens manufacturing, and e-commerce.
Yes. The Payroll worksheet supports roles, salaries, effective staffing dates, and annual-average FTE assumptions.
No. EBITDA excludes items such as capital spending and financing cash flows; review the Cash Flow Statement for liquidity.
Yes. Dashboard financing controls allow facilities and repayment terms; Low, Base, and High scenarios adjust revenue and cost multipliers.
No. It is an illustrative owner-funding estimate, not committed financing or evidence of tested cash sufficiency.
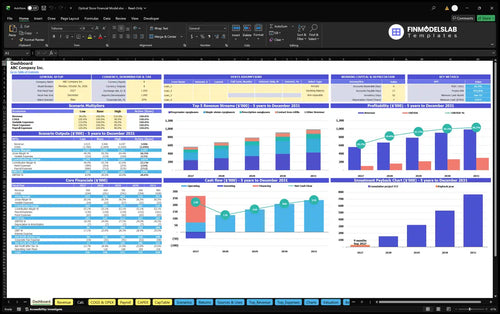
KPIs, forecasts, and cash flow at a glance.
Key assumptions and calculations driving revenue forecasts.
Funding sources, spending, and closing cash.
Cash break-even, payback, and ROIC.
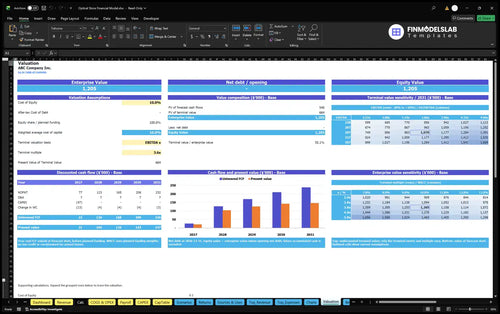
DCF valuation and sensitivity analysis.

Largest costs and spending trends.
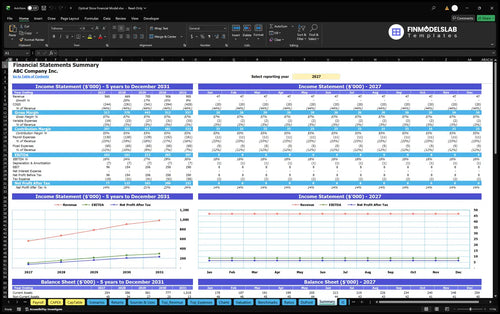
Annual and monthly financial performance.
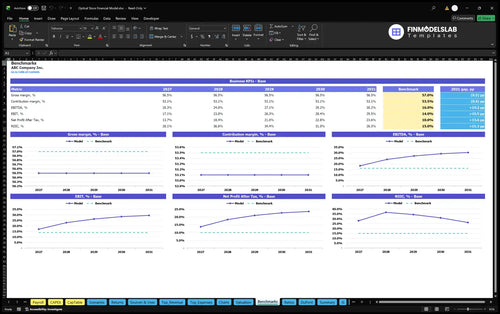
Compare margins and returns to benchmarks.

It took the fear out of starting from zero. I had a clean optical store model ready to edit in minutes, and it saved me from spending a whole afternoon building tabs myself.
The cash flow tab made runway and shortfalls much easier to see. I could spot a possible funding gap early and adjust my plan before our lender call.

I didn’t have to build revenue, expense, and profit lines by hand. What would’ve taken me most of a day was done in under an hour, so I could move on to pricing and store planning.