Osint Service Financial Model Template for Excel and Google Sheets

Five-year projections. Three scenarios. Every statement. One Excel file.
Open Source Intelligence Service Financial Model head image summarizing the model purpose and structure, showing where dashboard, inputs, scenarios, reports and valuation tabs help plan funding, revenue and runway.
Fully Editable
Instant Download
Professional Design
Pre-Built
No Expertise Is Needed
Open Source Intelligence Service Financial Model head image summarizing the model purpose and structure, showing where dashboard, inputs, scenarios, reports and valuation tabs help plan funding, revenue and runway.
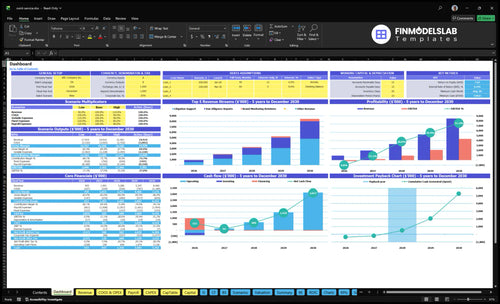
Open Source Intelligence Service Financial Model dashboard summarizes key KPIs, runway and cash position with a dynamic dashboard, helping founders spot cash-flow blind spots and present investor-ready metrics.
Open Source Intelligence Service Financial Model ROIC calculation and charts showing return on invested capital by business line, highlighting profitability timing and capital efficiency for investor-ready analysis.
Open Source Intelligence Service Financial Model break-even calculation and charts showing when revenue covers fixed and variable costs, helping founders pinpoint profitability timing and unit economics to avoid cash-flow blind spots.
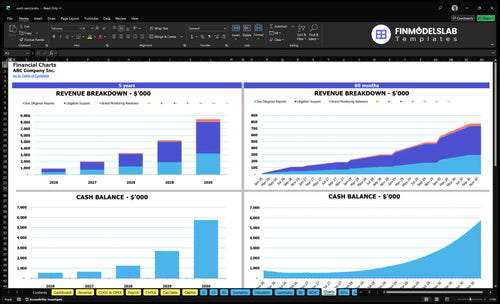
Open Source Intelligence Service Financial Model charts visualizing revenue growth, margin trends, cash runway and key financial metrics for stakeholder reporting with polished, dynamic KPI visuals.
Open Source Intelligence Service Financial Model ratios tab showing key financial ratios (liquidity, profitability, efficiency) to assess performance, returns and risk with clear investor-ready metrics and error checks.
Open Source Intelligence Service Financial Model valuation showing enterprise and equity valuation methods, helping estimate company value, investor returns and exit scenarios with clear sensitivity analysis.
Open Source Intelligence Service Financial Model revenue inputs tab showing customizable sales drivers, pricing tiers, client segments and subscription/contract assumptions to model top-line growth and scenario-ready forecasts
Open Source Intelligence Service Financial Model COGS and opex inputs tab outlining cost drivers, vendor and subscription assumptions, and operating expenses; lets users customize margins and scenario-ready forecasts.
Open Source Intelligence Service Financial Model capex inputs allowing customization of capital expenditures, asset lifecycles and depreciation schedules; fully customizable for scenario-ready forecasting and runway planning
Open Source Intelligence Service Financial Model payroll inputs showing staffing levels, salaries, benefits and hiring timelines; lets users customize headcount, cost drivers and ramp assumptions for scenario-ready forecasts and payroll planning.
Open Source Intelligence Service Financial Model scenarios charts showing low/base/high forecasts to compare revenue and costs, helping test assumptions and funding needs and fix weak scenario testing.
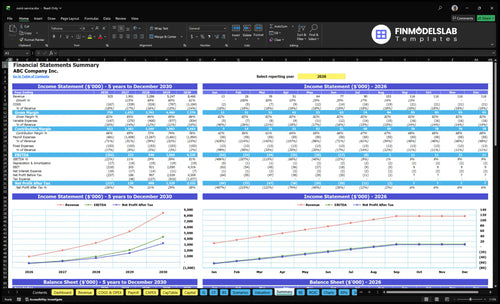
Open Source Intelligence Service Financial Model financial summary showing consolidated projections and key metrics delivering P&L overview, cash runway and liquidity position for investor-ready reporting
Open Source Intelligence Service Financial Model income statement report showing automated P&L deliverables, revenue and expense breakdowns and multi-year profit projections to clarify profitability and investor expectations
Open Source Intelligence Service Financial Model cash flow report showing projected cash inflows, outflows and runway estimates to assess liquidity, funding needs and uncover cash‑flow blind spots for investors.
Open Source Intelligence Service Financial Model balance sheet report showing projected assets, liabilities and equity to clarify financial position, support investor-ready presentations and spot balance risks
Open Source Intelligence Service Financial Model top expenses report showing major cost drivers and expense breakdown to identify biggest burn items, inform budgeting, runway and investor-ready forecasts.
Open Source Intelligence Service Financial Model top revenue report showing revenue streams and key drivers, highlighting main customers/products and trends to clarify growth drivers and investor-ready revenue mix.
Open Source Intelligence Service Financial Model sources & uses report detailing funding needs, allocation of capital and uses of proceeds to support runway, startup costs and investor-ready funding plan
Open Source Intelligence Service Financial Model dupont report showing return on equity drivers—profit margin, asset turnover and leverage—to diagnose profitability drivers and clarify investor expectations.
Open Source Intelligence Service Financial Model captable inputs and calculations showing equity ownership, funding rounds, dilution, and option pool settings; lets users customize ownership assumptions and fundraising scenarios.
Open Source Intelligence Service Financial Model KPI charts visualizing subscriber growth, MRR, churn, CAC payback and cash runway for stakeholder reporting with polished, dynamic visuals.
Fully Editable
Instant Download
Professional Design
Pre-Built
No Expertise Is Needed
Open Source Intelligence Service Bundle
See included products:
Financial Model iOpen Source Intelligence Service Bundle Financial Model template included in this product.
$149 $109
ADD TO YOUR ORDER
Business Plan iOpen Source Intelligence Service Bundle Business Plan template included in this product.
$79 $59
Pitch Deck iOpen Source Intelligence Service Bundle Pitch Deck template included in this product.
$49 $29
YOU SAVE $0 TODAY
30-Day Money-Back Guarantee
Created by a Former CFO
Updated for 2026
One-Time Purchase
Description
MODEL OVERVIEW

What Is Open Source Intelligence Service?

This editable five-year workbook predicts the revenue from OSINT services from active customers, hours payable and hourly rates, and then combines the results with statements and analysis of scenarios.

Use it to plan customer acquisition, work in providing services, prices, costs, personnel, capital needs and cash efficiency before making operational decisions.

The edited start time, customer cohorts, marketing, CAC, lifetime, hours and rates are reported monthly calculations that fit into model reports.

Driver-based planning Change of operational assumptions to see how customer activity and price flow through anticipated financial results.
CLIENT ENGINE BETWEEN TIMES

How Does Model Calculate Revenue from Open Source Intelligence Service?

The model takes over customers from spending marketing and CAC, preserves cohorts by life, transforms active customers into billed hours, and prices of these hours by level.

01

Buy Clients

Marketing expenditure divided by CAC determines new customers each month.

02

Horizontal

New customers are assigned at different service levels using editable percentages.

03

Stop the Cohorts

Customers starting and non-exhaustive cohorts remain active throughout the life of each level.

04

Build Pay Hours

Active customers multiply for monthly hours paid to create a level of workload.

05

Calculate Income

Hours paid multiply by hourly rates and then revenues are added up at different levels and months.

FORM OF CORRECTION Revenue = Hours Paid × Hourly Rate
01 / REVENUE

How to Structure Client Income?

The income sheet organises acquisition, cohort, service allocation, settlement hours and pricing assumptions that directly supply the calculation of customer income and cohorts.

Open Source Intelligence Service Worksheet revenue showing marketing budget, CAC, customer allocation, life periods, active customers, hours paid and hourly rates REVENUE
Revenue shows acquisition, customer cohorts, hours paid and hourly prices.
02 / COGS & OPEX

How Are Operational Costs Planned?

The COGS & OPEX card separates direct costs, variable costs and fixed operating costs from annual assumptions and monthly forecasts.

Open Source Intelligence Service COGS and OPEX worksheet showing the percentages of direct costs, variable expenditure, fixed expenditure, schedule and monthly forecasts COGS & OPEX
COGS & OPEX shows direct, variable and fixed expenditure schedules.
03 / SCENARIOS

How to Compare Low, Basic and High Cases?

The scenario sheet compares low, base and high revenues, margin, premium premium and the EBITDA paths over five years.

Open Source Intelligence Service Worksheet Scenarios with low, base and high revenue charts, gross margin, premium margin and EBITDA SCENARIOS
The scenarios maps compare revenues, margins, premiums of contributions and cases of EBITDA.
04 / DASHBOARD

What Does the Distribution Board Have in Common?

The table includes the control of scenarios, financing and structure of working capital, basic finances, revenue mix, profitability, cash flow and return on investment charts.

Open Source Intelligence Service Dashboard showing model settings, scenario multipliers, KPIs, revenue mix, profitability, cash flow and return on investment DASHBOARD
The navigational desk tables summarise configuration controls, profitability, cash flow and return.
FIT OF PRODUCTS

Is the Open Source Intelligence Service Finance Model Suitable for You?

This model fits customer coordinates, billable hours services; structural adjustment is more appropriate when revenue logic, operational schedules or reporting requirements vary significantly.

MODEL BY MADA READY

Good Example

  • Revenue is driven by active customer cohorts, hours paid and hourly rates.
  • The acquisition of the customer is related to marketing and editable assumptions of CAC.
  • Service levels use different allocations, lifetimes, hours and price inputs.
  • You want a five-year model with scenarios and integrated financial statements.
CUSTOMS STRUCTURE

Consider Custom Pattern

  • Revenue depends on subscription, transaction fees, stock sales or other logic.
  • Customer activity requires ability, use, geographical structure or contract structure outside the customer cohorts.
  • You need operational schedules that are significantly different from costs, wages or capital modules.
  • You need reporting or financial structures tailored to the template structure that is no longer set.

The template is the starting point of planning, not a guarantee of performance.

FINANCIAL MODEL SERVICE

Do You Need a Model Built Around Your Requirements?

The Financial Models Laboratory may build or adapt a financial model where revenue logic, operational schedules or reporting requirements require a different structure.

ORDER A CUSTOM FINANCIAL MODEL
AFTER CONTROL

What You're Getting

After making the payment you will receive an editable Excel financial model for the five-year OSINT forecast with scenarios and related financial reports.

01

Editable workbook

Open Excel file and replace basic assumptions with business inputs.

02

Five-year forecast

Review of the expected results during the monthly periods of 60 and annual financial years.

03

Analysis of scenarios

Compare low, baseline and high cases using model scenario control.

04

Financial statements

Review of the Income Statement, Cash Flow Statement, Balance and Results Panels.

BEFORE BUYING IMPORTANT INFORMATION

Open Source Intelligence Service Financial Model FAQ

The basic answers are visible in their entirety, without clicking on the accordion.

01

How Does the Open Source Finance Model Intelligence Service Calculate Revenue?

Revenues are calculated from active customers according to service level, monthly billing hours on active customers and hourly rates. New customers come from the marketing of expenditure divided by CAC and remain active according to the life of each cohort.

02

What are the assumptions I can change?

You can change the launch date, customer start, annual marketing budget, monthly seasonality, CAC, level allocation, customer life, hours payable and hourly rates.

03

What can I compare in Low, Base and High scenarios?

The scenario view allows to compare low, base and high revenue paths, gross margin, premium premium and EBITDA in the five-year forecast.

04

What financial results are taken into account?

The model includes income statement, cash flow statement, balance sheet, dashboard, summary, profitability analysis, ROIC, graphs, indicators and valuation views.

05

Can the Financial Models Lab adapt it to its own requirements?

Yes. The Financial Models Laboratory can build or adjust a model when revenue logic, work schedules or reporting requirements need a different structure.

06

Is the workbook a forecast or a guarantee?

This is a forecast based on the possible editing assumptions, not a guarantee of the results of business activity or financial results.

What Does the Open Source Intelligence Service Financial Model Contain?

This OSINT financial model is a comprehensive toolkit containing everything you need to build a robust financial plan, from detailed revenue projections and expense schedules to valuation analysis and break-even calculations.
osint service financial model dashboard financialmodelslab

All-in-one Dashboard

Core inputs and core outputs

osint service financial model scenarios financialmodelslab

Low/Base/High

Three scenario analysis

osint service financial model charts financialmodelslab

Professional Charts

Presentation ready

osint service financial model dupont financialmodelslab

ROE Components

DuPont analysis

osint service financial model revenue financialmodelslab

Revenue Inputs

Researched revenue assumptions

osint service financial model summary financialmodelslab

Bank-Ready Reports

Lender-friendly financial outputs

osint service financial model top revenue financialmodelslab

Revenue Breakdown

Revenue stream detailed view

osint service financial model kpis financialmodelslab

KPI Dashboard

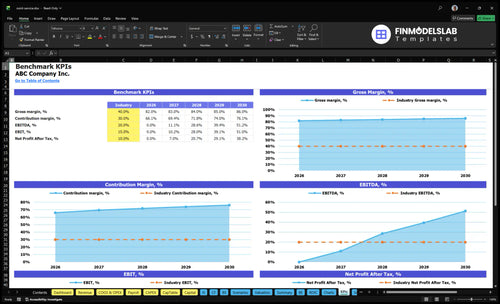
Performance metrics benchmark

Trusted by 25,000+ startup founders, investors and CPAs

Scattered Reports Finally Organized

Megan Carter, NY

5 star rating

I stopped hunting through five different files for statements and charts. Now everything sits in one place, and I save about two hours every month-end close.

Runway Was Easy To See

Daniel Brooks, TX

5 star rating

I could finally see runway and likely shortfalls month by month instead of guessing. That made our next planning meeting faster, and we booked it with clearer numbers.

Safe From Formula Breaks

Lauren Mitchell, FL

5 star rating

I liked how the template kept the formulas clean and easy to follow. One bad cell used to throw off my whole model, but now I catch issues fast before they spread.