

Revenue & Calc
Edit monthly store traffic, purchase conversion, saleable units per transaction, product mix, selling prices, and seasonality. Calc distributes activity across the forecast months and consolidates category revenue.


The Paint Store Financial Model is an Excel template for projecting merchandise sales, operating expenses, staffing, and EBITDA for an independent paint and decorating supply retailer. Its monthly demand-driven calculations translate customer visits into sales across five product categories and connect to financial statements and management reports.
The documented case models a 3,000-square-foot Indianapolis store serving homeowners and small painting contractors from 2026 through 2030. It excludes painting services, manufacturing, rentals, a delivery fleet, and franchise fees; all displayed forecast figures are illustrative planning assumptions, not observed sales or guaranteed results.
Connected operating inputs, schedules, financial statements, and decision reports let you change the paint retailer assumptions without building a forecast from scratch.
Edit monthly store traffic, purchase conversion, saleable units per transaction, product mix, selling prices, and seasonality. Calc distributes activity across the forecast months and consolidates category revenue.
Separate merchandise and tinting costs from transaction fees, promotions, store overhead, and fixed staff pay. Role-based FTE plans and salary assumptions flow through payroll calculations.
Enter opening equipment, fixtures, preopening spending, ownership contributions, and optional debt facilities. The related schedules distinguish investing and financing activity from the store’s merchandise earnings.
Income Statement, Cash Flow, and Balance Sheet reports provide monthly views beyond the documented EBITDA example. Summary, Sources & Uses, and financial charts bring related reporting together.
Sales begin with one pool of qualified store visits, then apply conversion, basket size, monthly seasonality, product allocation, and realized prices.
Qualified visits increase from 1,000 per month in 2026 to 1,600 in 2030, with conversion rising from 65% to 68% and 2.1 units per transaction. Twelve monthly demand multipliers repeat each year and sum to 12, preserving annual volume.
The resulting units are allocated once: 42% interior wall paint, 18% exterior paint, 15% primers and sealers, 10% wood stains and finishes, and 15% painting supplies. Their respective selected prices are $55, $65, $32, $42, and $12 per saleable unit.
The Revenue Forecast organizes visits, conversion, basket units, seasonality, product prices, and merchandise mix. Monthly calculations turn these editable inputs into interior paint, exterior paint, primer, stain, and supplies revenue without counting the same transaction pool twice.
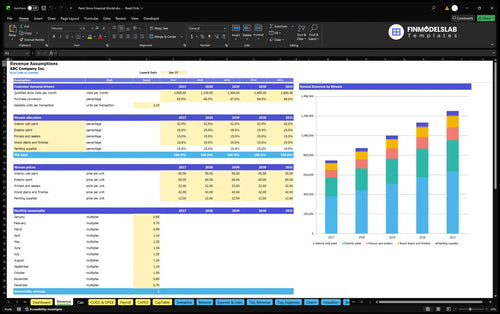
1,000 visits/month × 65% conversion × 2.1 units/transaction × $45.60 weighted unit price × 12 seasonality-adjusted months = $746,928 annually.
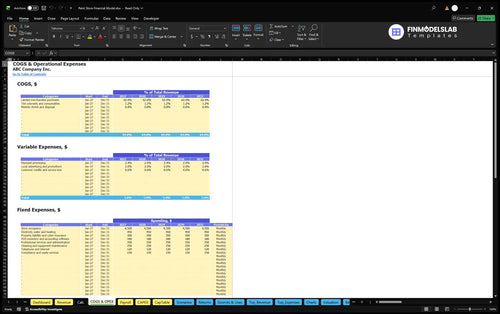
The model treats direct merchandise costs, variable selling costs, fixed store overhead, and salaried personnel as distinct EBITDA deductions.
Direct costs total 64% of revenue: 62% landed merchandise, 1.2% tint consumables, and 0.8% shrink and disposal. Variable costs add 5%: 2.4% payment fees, 2% local promotions, and 0.6% customer credits.
Fixed costs total $75,600 annually, including $4,500 monthly occupancy plus utilities, insurance, software, maintenance, administration, connectivity, and compliance. Salaries are excluded from these expenses.
The COGS and Operating Expenses report separates merchandise, sales-linked charges, and fixed overhead. Adjust purchase rates, transaction fees, or rent to see the effects on gross margin and EBITDA.
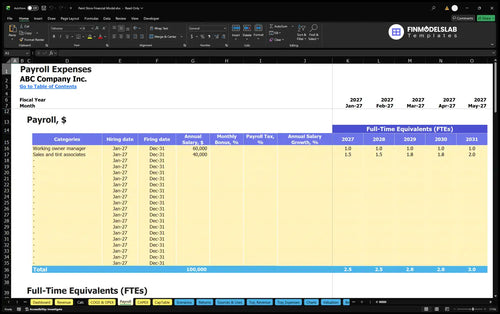
The working owner-manager earns $60,000 annually; sales and tint associates earn $40,000 per annual-average FTE, increasing from 1.5 FTE in 2026 to 2.0 in 2030. Payroll is excluded from all other expense lines.
The Payroll Forecast summarizes role-level FTE, annual base pay, and monthly salary charges. Edit tint-counter coverage to measure staffing costs as traffic grows, without equating FTE directly with workers on each shift.
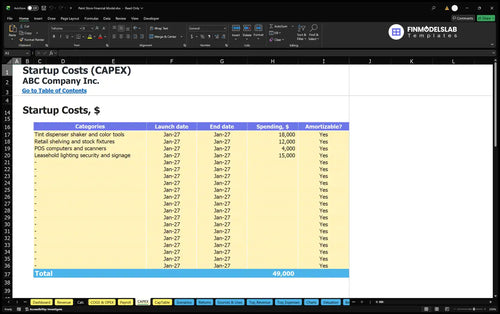
Startup assets, one-time opening cash requirements, inventory funding, and owner contributions are modeled separately from the annual operating expense forecast.
The case budgets $49,000 for durable assets: $18,000 tinting equipment, $12,000 fixtures, $4,000 POS hardware, and $15,000 leasehold improvements. Deposits, setup, prelaunch advertising, and training add $18,000.
Opening inventory is $76,862 and reserves are $177,745. The reserve is a policy assumption of three months of first-year recurring outflows, not proof that cash will be sufficient.
The Capital Expenditure Plan schedules tinting equipment, retail fixtures, POS hardware, and leasehold improvements. It tracks asset purchases and monthly depreciation separately from operating EBITDA.
Accounts receivable and payable days are zero because customers pay at purchase and suppliers are paid on delivery, while inventory days are 59. These working-capital controls affect cash timing and financial position, not merchandise revenue.
Initial owner funding totals $321,607 for assets, prelaunch spending, stock, and reserves. No outside debt is committed; Dashboard debt controls allow additional financing scenarios.
The Sources and Uses of Funds report reconciles owner equity, optional financing, sales receipts, and spending. It distinguishes initial funding and cash allocation from merchandise revenue and EBITDA.

The documented operating illustration forecasts rising merchandise sales and EBITDA from 2026 through 2030, before depreciation, interest, and taxes.
| Year | Revenue | Operating Expenses | EBITDA |
|---|---|---|---|
| 2026 | $746,928 | $710,980 | $35,948 |
| 2027 | $872,182 | $797,406 | $74,776 |
| 2028 | $1,000,884 | $896,210 | $104,674 |
| 2029 | $1,133,032 | $987,392 | $145,640 |
| 2030 | $1,250,243 | $1,078,267 | $171,975 |
Rounded to whole dollars; differences of $1 can occur when independently rounded figures are compared.
Projected 2026 EBITDA is $35,948 on $746,928 revenue and $710,980 operating expenses. By 2030, EBITDA reaches $171,975 on $1,250,243 revenue as merchandise volume grows faster than store overhead.
These figures are forecasts, not industry averages or actual results. The Income Statement calculates net profit after additional accounting items; net income cannot be inferred from these EBITDA-only figures.
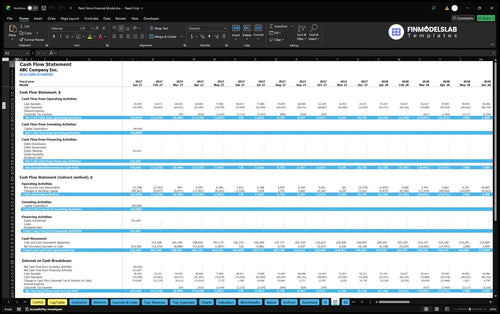
The Cash Flow Forecast tracks receipts, payments, investment, and financing by month. Inventory purchases and store equipment can require cash even when the store forecasts positive EBITDA.
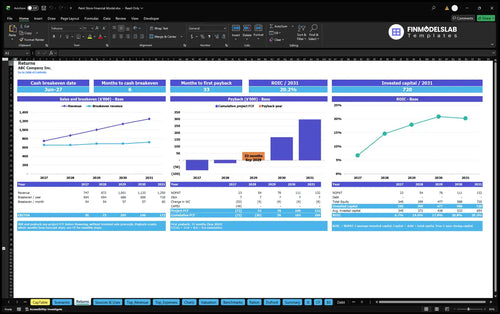
Returns and scenario reports help evaluate operating sales thresholds and investment outcomes, but the documented case supplies no measured payback date or ROIC result.
Sales break-even compares revenue with operating costs; cash break-even depends on receipt and payment timing. Investment payback measures accumulated project cash flows against opening investment, while annual ROIC compares returns with invested capital.
Test lower traffic, higher merchandise costs, altered staffing, or slower inventory turnover. Dashboard Low, Base, and High multipliers feed scenario comparisons of revenue, gross margin, contribution margin, and EBITDA.
The Returns analysis covers sales and cash break-even, cumulative project cash flow, investment payback, and annual ROIC. These measures answer different investment questions and require the buyer’s own operating assumptions.
Valuation offers DCF sensitivities, while Benchmarks compares ratios with user-entered reference values. Neither supplies a verified store valuation or independent Indianapolis paint-industry benchmark.
The questions below clarify the editable assumptions, included reports, and limits of the illustrated financial projections.
Yes. Edit prices and the five category allocation shares; monthly category revenue is calculated from the resulting sold-unit pool.
No. The documented revenue streams cover paint, primers, finishes, and supplies sold by a retail store, not labor or contracting revenue.
Yes. Payroll includes staff-role salaries and annual-average FTE, while COGS & OPEX contains fixed overhead such as occupancy.
Yes. The workbook includes Cash Flow and Balance Sheet reports, although the supplied illustration provides verified numeric outputs only through EBITDA.
No. The illustrative funding is owner equity; optional Dashboard debt controls allow separate borrowing assumptions to be entered.
No. The $171,975 forecast EBITDA is illustrative operating earnings before depreciation, interest, and taxes, not guaranteed net profit or cash flow.
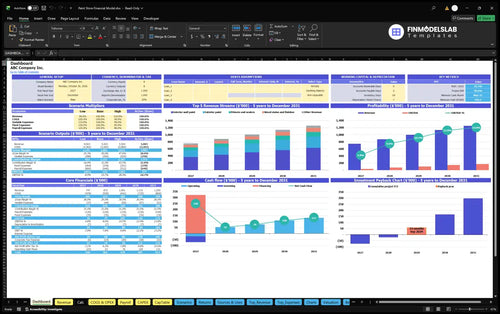
KPIs, forecasts, and cash flow at a glance.
Key assumptions and calculations driving revenue forecasts.
Funding sources, spending, and closing cash.
Cash break-even, payback, and ROIC.
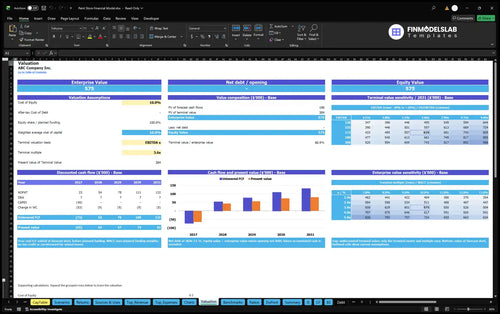
DCF valuation and sensitivity analysis.

Largest costs and spending trends.
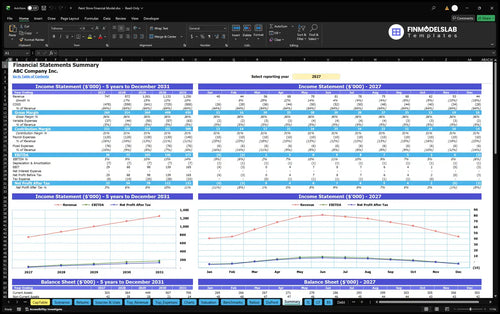
Annual and monthly financial performance.
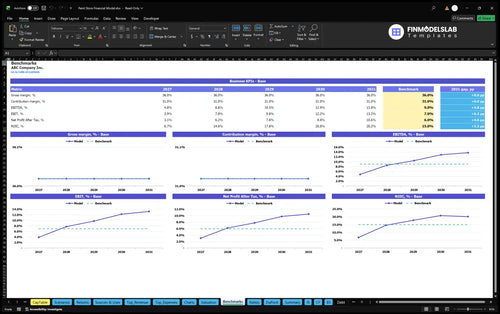
Compare margins and returns to benchmarks.

I wasn’t sure what investors needed to see, and this template gave me the right structure right away. It helped me book a planning call with a lender after I could present the numbers clearly.

The margin and break-even tabs made it easy to see where the business actually stands. I cut hours of spreadsheet work and finally had a clean view of profitability.
Starting from scratch felt overwhelming, but this gave me a clear place to begin. I had a working draft ready the same day instead of spending days staring at a blank file.