

Revenue and Calc
Edit store visits, open days, conversion, seasonality, category shares, and net basket prices. Revenue holds assumptions; Calc generates monthly checkouts and sales by primary category.


The Party Supply Store Financial Model is an Excel template that converts store visits, checkout conversion, seasonal demand, and basket prices into monthly sales. It then applies merchandise costs, operating expenses, and staffing to project EBITDA.
The illustration models a leased 2,000-square-foot suburban Indianapolis store, with a January 31, 2026 launch counted in full. The 2026–2030 forecast excludes delivery, installations, rentals, catering, online sales, and customer trade credit.
The linked worksheets cover store demand, inventory-related expenses, staff, opening investment, financial statements, and management decisions.
Edit store visits, open days, conversion, seasonality, category shares, and net basket prices. Revenue holds assumptions; Calc generates monthly checkouts and sales by primary category.
Set merchandise and helium costs, transaction fees, promotions, rent, and fixed overhead. Payroll independently plans staffing, salaries, and personnel costs.
Schedule store improvements and equipment, record equity contributions, and assess optional loan facilities. The illustrated store uses no committed outside financing.
Income Statement, Cash Flow, Balance Sheet, and Summary organize profitability, liquidity, and financial position. Dashboard and Charts visualize the modeled results.
Low, Base, and High cases test operating assumptions. Returns, Valuation, Ratios, Sources & Uses, and Checks provide additional analysis and reconciliation tools.
The revenue forecast starts with one storewide checkout pool, then assigns each checkout to exactly one merchandise category.
In 2026, expected checkouts use 60 daily visits, 26 open days monthly, and 70% conversion. Planned traffic rises to 70, 78, 84, then 88 visits per day through 2030.
Calendar demand factors repeat annually, from 0.80 in January to 1.30 in October. They shift the timing of one checkout pool without adding sales channels.
The Revenue Forecast connects store traffic, conversion, seasonal demand, and the weighted basket price to monthly sales. Adjust these drivers to compare different revenue expectations.

The five exclusive basket types are balloons ($38; 30% of checkouts), tableware ($45; 25%), decorations ($55; 20%), party favors ($32; 15%), and gift wrap ($22; 10%). Together they average $40.65 per checkout.
Balloon sales include in-store inflation, with helium treated as a direct cost. Sales are net of ordinary returns, exclude sales tax, and assume unchanged nominal prices through 2030.
60 visits/day × 26 days/month × 70% conversion × 12.0 annual seasonal factor × $40.65 per basket ≈ $532,678 revenue.
The model separates merchandise-related direct costs, sales-variable expenses, monthly fixed overhead, and base salaries to avoid double counting.
Direct costs total 56.5% of revenue: resale stock 51%, helium and inflation supplies 2%, inbound freight 2%, and stock damage 1.5%. These expenses reduce gross margin.
Variable operating costs total 5.5% of sales: processing 2.5%, local promotion 2.5%, and checkout consumables 0.5%. They are separate from direct costs and salaries.
The COGS and Operating Expenses forecast shows direct merchandise costs, variable selling expenses, and fixed store overhead. Edit cost rates and monthly budgets to test margin sensitivity.
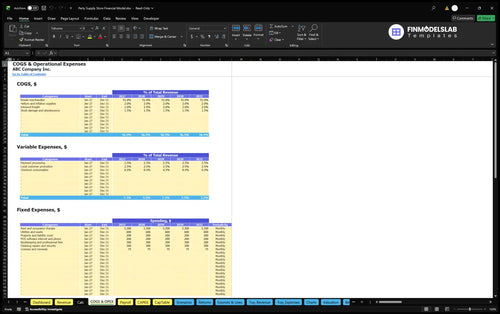
Fixed overhead is $59,700 annually, including $3,300 monthly rent and occupancy charges. Other items cover utilities, insurance, software, bookkeeping, cleaning, security, and licensing; salaries are excluded.
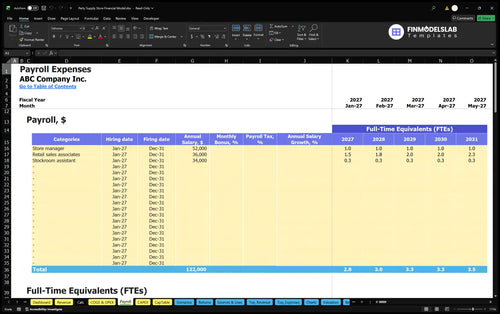
Payroll covers the full-time owner-manager ($52,000), a 0.25-FTE stockroom assistant ($34,000 per FTE), and sales associates growing from 1.5 to 2.25 average FTE. Employer taxes, benefits, and personal taxes are excluded.
The Payroll Forecast links staffing FTE and annual base pay to personnel expenses without counting salaries in other costs. Annual base payroll rises from $114,500 in 2026 to $141,500 in 2030.
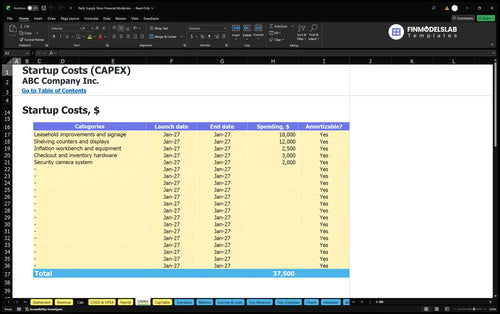
Opening assets, prelaunch cash needs, working capital, and owner contributions are planned separately from recurring operating expenses.
Listed opening assets are $18,000 in improvements and signage, $12,000 in shelving, $2,500 in inflation equipment, and $3,000 in checkout hardware. The security camera system has no separately stated amount.
The Capital Expenditure Plan schedules asset spending and applicable depreciation. Opening improvements and equipment are distinct from the monthly store expense forecast, which the illustrative brief reports through EBITDA.
Separate opening cash includes refundable deposits, permits, professional setup, marketing, and training. Working capital assumes zero receivable days, 14 payable days, and 87 inventory days.
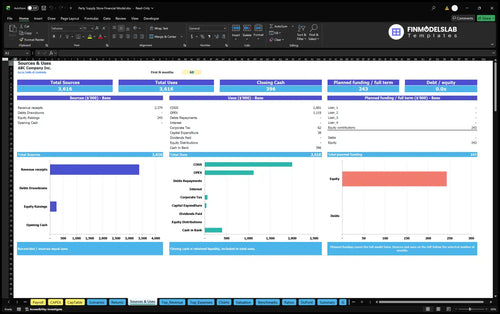
Initial owner funding of $242,836 is estimated to cover startup assets, prelaunch cash, opening working capital, and a three-month operating reserve. Opening stock uses the January–March demand average of 0.85; later cash sufficiency is untested.
The Sources and Uses of Funds report tracks cash contributed, allocated, and retained across the forecast. The selected case assumes owner contributions only, although the Dashboard supports optional borrowing inputs.
The illustrative case projects sales, operating expenses, and EBITDA annually from 2026 to 2030.
| Year | Revenue | Operating Expenses | EBITDA |
|---|---|---|---|
| 2026 | $532,678 | $504,460 | $28,217 |
| 2027 | $621,457 | $568,503 | $52,954 |
| 2028 | $692,481 | $621,538 | $70,943 |
| 2029 | $745,749 | $654,564 | $91,184 |
| 2030 | $781,260 | $685,582 | $95,679 |
Planning estimates, not observed results; rounding to whole dollars can create small differences between displayed figures.
Annual sales rise from $532,678 in 2026 to $781,260 in 2030 as visits increase; net prices and category shares stay flat. Seasonality changes monthly sales timing.
In 2026, expenses comprise $300,963 in direct costs, $29,297 in variable costs, $59,700 in overhead, and $114,500 in base payroll. EBITDA excludes depreciation, interest, and taxes; it is not net profit or free cash flow.
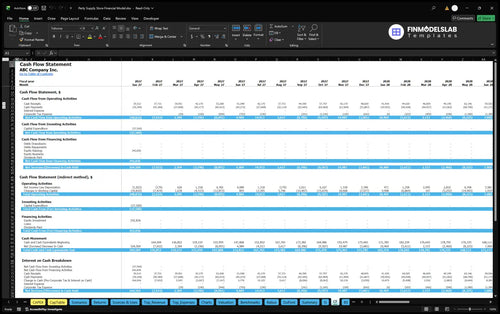
The Cash Flow Forecast separates operating receipts and payments, investing and financing flows, and closing-cash reconciliation. Review inventory commitments and funding timing there, rather than using EBITDA as evidence of available cash.
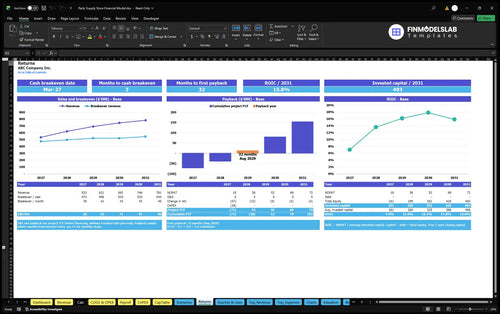
The workbook supports operating break-even, project cash recovery, invested-capital returns, and scenario comparisons as different planning questions.
Sales break-even asks when operating revenue covers costs; cash break-even tracks cash coverage. Project payback measures cumulative cash recovery, while annual ROIC relates returns to invested capital.
Dashboard Low, Base, and High multipliers adjust revenue, COGS, variable costs, fixed overhead, and payroll. Compare their gross margin, contribution margin, and EBITDA effects before making operating decisions.
The Break-Even, Payback and ROIC report evaluates operating cost coverage, cash break-even, cumulative project recovery, and annual invested-capital returns. EBITDA alone cannot establish a payback date or ROIC.
Valuation supports DCF and assumption sensitivity; Checks reviews reconciliation and input issues. No verified enterprise value, loan approval, or investment return is supplied for this hypothetical store.
Answers to common questions about editing, scope, operating projections, and financial reports.
Yes. Edit daily visits, open days, checkout conversion, monthly demand, basket shares, and prices.
No. Each checkout is assigned once to balloons, tableware, decorations, party favors, or gift wrap.
Yes. The January 31, 2026 launch month counts as a full forecast month.
No. Fixed employee base pay is in Payroll, not in COGS, variable costs, or fixed overhead.
No. The example is an in-store merchandise retailer with balloon inflation performed on premises.
Yes. Dashboard has optional debt controls and Low, Base, and High scenario inputs; the example assumes owner financing only.
No. Those require the separate Income Statement, Cash Flow, and Returns calculations; the provided illustrative results stop at EBITDA.
No. Figures are planning estimates for a hypothetical suburban Indianapolis retailer, not observed industry results.
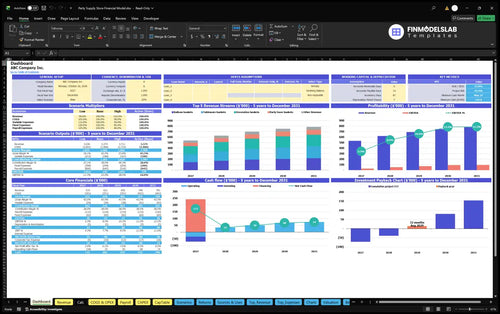
KPIs, forecasts, and cash flow at a glance.
Key assumptions and calculations driving revenue forecasts.
Funding sources, spending, and closing cash.
Cash break-even, payback, and ROIC.
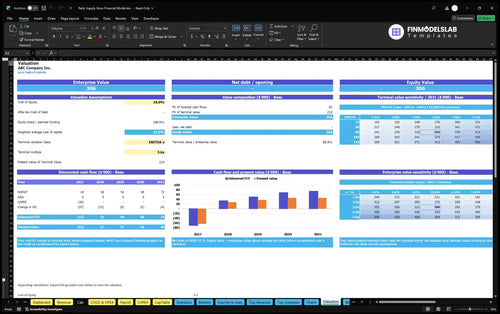
DCF valuation and sensitivity analysis.

Largest costs and spending trends.
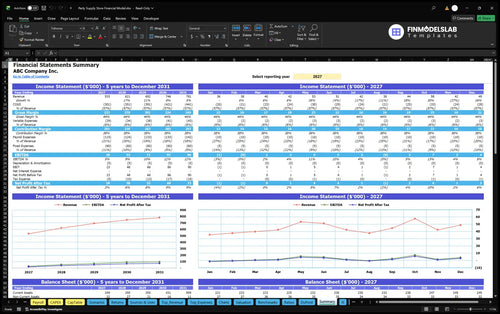
Annual and monthly financial performance.
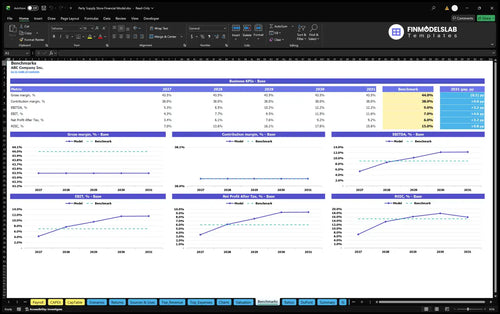
Compare margins and returns to benchmarks.

I stopped hunting through separate files for statements and charts. Now everything sits in one place, and I could send a clean update to my partner in minutes.

Building the model by hand was eating up my evenings. This template cut my planning time by about 10 hours and gave me a solid draft the same day.
I could finally see where the margins were strong and where break-even sat. That made my pricing review much clearer and helped me book a lender meeting with better numbers.