

Revenue and Calc
Edit purchasing customers, units per customer, sales mix, receipts, and launch timing. Calc converts volume inputs into five monthly revenue streams.


This Pharmacy Financial Model is an Excel template for planning an independent US community pharmacy from 2026 through 2030. It connects monthly purchasing customers, items sold, realized receipts, merchandise costs, pharmacy staffing, and overhead to projected operating EBITDA.
The illustrative case is a leased, approximately 1,800-square-foot suburban store with insured and cash prescriptions plus a small retail front end. Prices and reimbursement assumptions are editable estimates, not a representation of any particular payer contract, pharmacy, or local market.
The workbook brings prescription and front-end sales planning together with cost schedules, staffing, startup investment, financing controls, and financial reporting.
Edit purchasing customers, units per customer, sales mix, receipts, and launch timing. Calc converts volume inputs into five monthly revenue streams.
Budget drug acquisition, dispensing materials, processing fees, fixed overhead, and FTE salaries without double-counting payroll.
Schedule opening assets, owner equity, and optional debt. Dashboard controls feed repayment and financing cash-flow schedules.
Inspect the Income Statement, Cash Flow, Balance Sheet, Summary, Scenarios, Returns, Valuation, Sources & Uses, and Checks for reporting and decisions.
Purchasing customers multiplied by units per customer form one demand-based sales pool allocated across five priced categories.
In 2026, 800 monthly purchasing customers buy an estimated three units each, creating 2,400 units. The monthly customer assumption grows to 1,100, 1,400, 1,700, and 1,900 for 2027–2030.
Unit shares: 66% generic prescriptions at $35, 14% brand at $260, 10% OTC at $14, 6% vitamins at $20, and the residual 4% health supplies at $25. All receipts are estimated per purchased unit.
The Revenue Forecast applies customer volumes, units per customer, category shares, and realized prices to annual sales. Calc handles monthly timing, including zero revenue before launch and a full launch month.
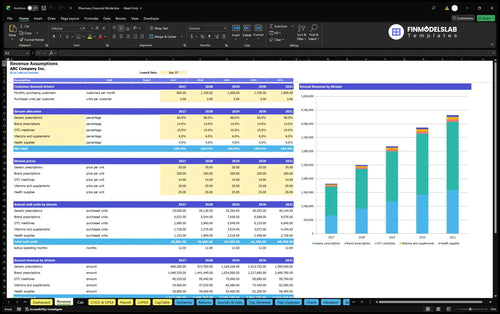
800 customers × 3 purchased units × $63.10 weighted receipt = $151,440 per month; 12 months = $1,817,280 in 2026.
The $63.10 weighted receipt applies once to the shared unit pool. Modeled receipts are net of payer concessions, and the plan imposes neither a separate capacity limit nor material monthly seasonality.
Change volume, mix, and receipts to test sales sensitivity; the estimates do not represent negotiated pharmacy reimbursement.
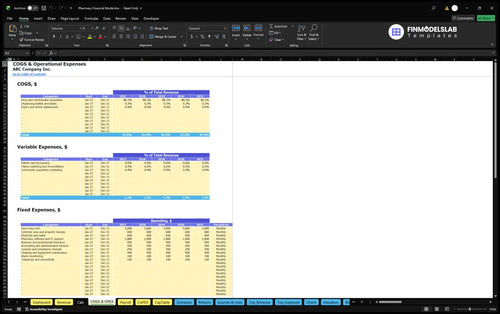
Direct acquisition and dispensing costs, other variable expenses, fixed overhead, and base payroll are calculated separately before EBITDA.
Estimated COGS equals 80.3% for acquisition, 0.3% for bottles and labels, and 0.4% for expiry and shrink: 81% of revenue in total.
Card processing (0.6%), claims switching (0.2%), and marketing (0.4%) produce 1.2% variable expenses. Annual fixed expenses are $93,600, including $3,600 monthly rent plus utilities, insurance, compliance, maintenance, and administrative services.
The COGS and Operating Expenses forecast separates acquisition, revenue-linked operating charges, and fixed overhead. Test how reimbursement and purchasing costs affect margins before payroll.
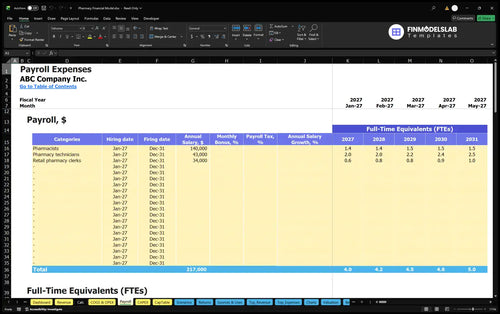
In 2026, staffing comprises 1.4 pharmacist FTE at $140,000 per FTE, 2 technician FTE at $43,000, and 0.6 clerk FTE at $34,000. Salaries are not part of COGS.
Base payroll rises from $302,400 in 2026 to $351,500 in 2030 as role-level FTE assumptions change. Each salary is counted once, separate from variable and fixed store costs.
The Payroll Forecast calculates personnel costs from FTE and role salaries. The workbook also provides hiring, bonus, and payroll-tax settings, although this example excludes employer taxes and benefits.
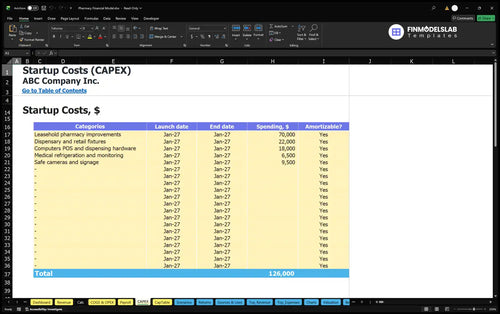
Opening equipment and improvements, prelaunch cash costs, working capital, and initial owner funding are planned outside recurring operating EBITDA.
Four quantified opening assets total $116,500: $70,000 in improvements, $22,000 in fixtures, $18,000 in computer and dispensing hardware, and $6,500 in refrigeration. Safes, cameras, and signage are additional assets without specified amounts.
Prelaunch permits, deposits, software setup, training, wages, and launch marketing are separate opening cash uses, not annual operating expenses or EBITDA deductions.
The Capital Expenditure Plan schedules pharmacy equipment and improvements by date and depreciability. It distinguishes asset investment cash outlays from ongoing operating costs.
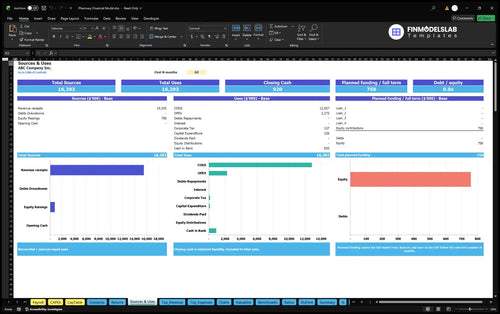
Estimated owner funding is $757,890, covering opening assets, prelaunch cash, opening net working capital, and a three-month operating reserve. The reserve is policy, not verified peak-cash sufficiency.
Working-capital inputs assume 12 receivables days, 15 payables days, and 30 inventory days. They change projected cash timing without automatically changing EBITDA.
Sources and Uses of Funds reconciles equity and optional debt with operating payments, investment, and retained cash. It helps compare the revised opening investment against planned funding.
The documented illustrative Base operating case shows rising annual revenue and EBITDA as monthly purchasing-customer assumptions increase.
| Year | Revenue | Operating Expenses | EBITDA |
|---|---|---|---|
| 2026 | $1,817,280 | $1,889,804 | -$72,524 |
| 2027 | $2,498,760 | $2,455,081 | $43,679 |
| 2028 | $3,180,240 | $3,039,557 | $140,683 |
| 2029 | $3,861,720 | $3,611,734 | $249,986 |
| 2030 | $4,316,040 | $3,992,885 | $323,155 |
Illustrative projections, rounded to whole dollars. Operating expenses include COGS, variable, fixed, and payroll costs.
The example moves from negative $72,524 EBITDA in 2026 to $323,155 in 2030, as annual revenue reaches $4,316,040 under the selected assumptions.
EBITDA is neither net profit nor cash. The Income Statement, Cash Flow, and Balance Sheet model additional financial measures, but the supplied case establishes no net income or closing cash figures.
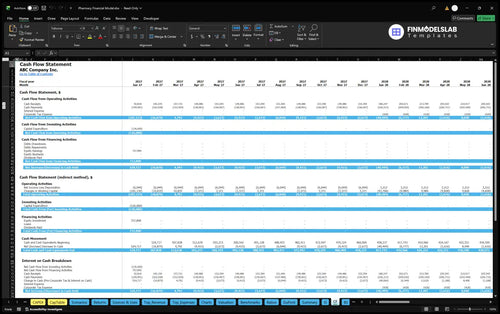
The Cash Flow Forecast separates operating cash, purchases, equity and debt movements, and opening-to-closing balances. Consult it for liquidity rather than treating EBITDA as available cash.
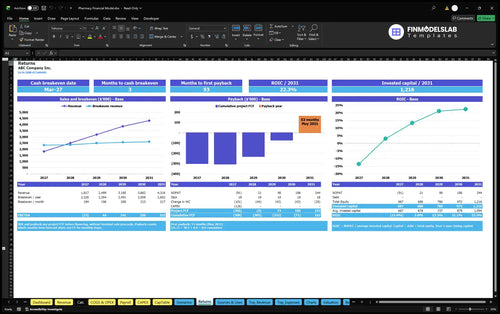
The workbook separates operational sales thresholds from cash recovery, financing requirements, and returns on invested capital.
Returns distinguishes sales break-even, cash break-even, investment payback, and annual ROIC. These address cost coverage, cash recovery timing, invested capital recovery, and capital productivity.
The supplied case establishes no payback month, ROIC, IRR, or discounted value; none can be inferred solely from EBITDA.
The Returns report analyzes operating sales thresholds, project free cash flow, payback, and annual ROIC. Enter pharmacy-specific investments and cash assumptions before using its outputs for decisions.
Dashboard Scenario Controls apply Low, Base, and High multipliers to revenue and all four cost layers. Scenarios compares operating margins and EBITDA; Debt and Valuation support separate financing decisions.
Designed for independent pharmacy operators, prospective buyers, and advisers testing conventional retail dispensing economics.
Test prescription mix, customer capture, FTE coverage, and startup funding. Specialty dispensing, compounding, mail order, clinical services, delivery sales, and franchise fees are outside this case.
Replace estimates with payer contracts, supplier quotes, lease terms, wage requirements, licensing costs, and opening inventory before relying on the projections.
These answers clarify how to adapt the forecast, what the illustrative figures represent, and which reports answer common planning questions.
Yes. Edit purchasing customers, purchased units per customer, generic and brand shares, retail category shares, and realized unit receipts in the Revenue inputs.
It uses estimated realized per-unit receipts net of concessions, not an independently verified insurer, PBM, or Medicaid reimbursement contract.
Yes. Base pay is planned in Payroll by full-time-equivalent role, and the illustrated costs do not count those salaries again in COGS or fixed overhead.
No. Opening assets and prelaunch cash uses are tracked separately; depreciation and investment cash flows appear in their corresponding financial reports.
Yes. Cash Flow, Sources & Uses, and Debt schedules support liquidity and financing analysis, but the supplied reserve is not a tested peak-cash sufficiency result.
No. Sales break-even, cash break-even, project payback, and ROIC require distinct calculations in Returns and cannot be inferred from EBITDA alone.
No. They are illustrative 2026–2030 projections based on estimated assumptions for one independent suburban US pharmacy, not observed industry results.
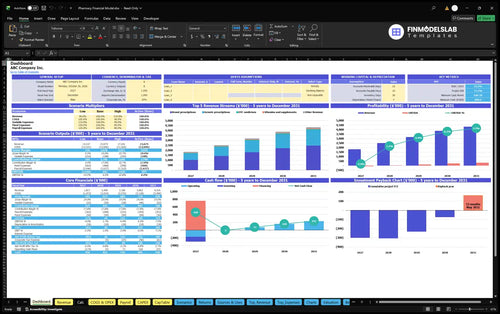
KPIs, forecasts, and cash flow at a glance.
Key assumptions and calculations driving revenue forecasts.
Funding sources, spending, and closing cash.
Cash break-even, payback, and ROIC.
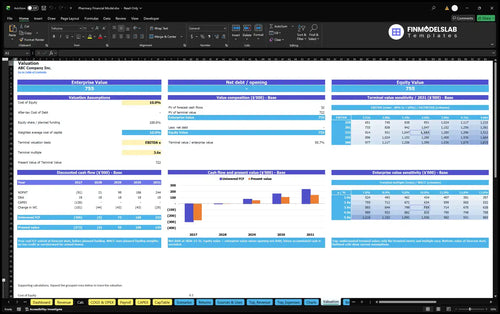
DCF valuation and sensitivity analysis.

Largest costs and spending trends.
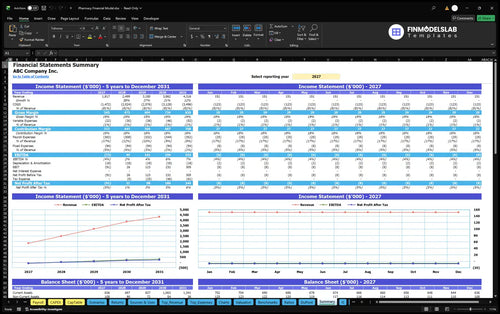
Annual and monthly financial performance.
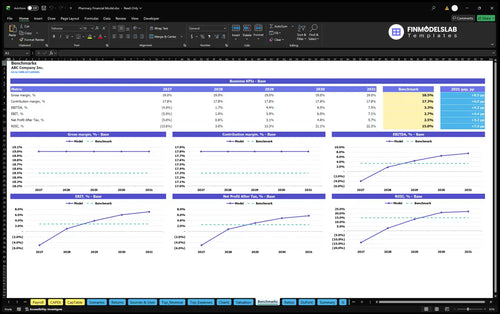
Compare margins and returns to benchmarks.

It brought pricing, costs, and growth assumptions into one place, so I stopped bouncing between tabs. I saved about 4 hours on my first pass and could finally explain every number without second-guessing it.

The cash-flow tabs made runway and shortfalls much easier to track. I booked a lender meeting the same day because I could show when cash would tighten and what funding gap I actually needed.
I could see margins and break-even without digging through formulas, which made the model far easier to use. It cut my review time by a couple of hours and gave me a cleaner base for pricing decisions.