

Revenue and Calc
Set class capacity, annual utilization, attendance allocation, realized prices, and launch timing; the monthly calculation schedule rolls these drivers into annual studio revenue.


This Pilates Studio Financial Model is an Excel template for an independent, eight-reformer small-group studio in Raleigh, North Carolina. It builds monthly financial projections for 2026–2030 from available class places, utilization, class mix, realized prices, payroll, and operating costs.
The illustrative setup uses an estimated 1,600-square-foot leased space and five reformer class formats, without retail, private lessons, a franchise, or a heated room. The supplied case documents operating projections through EBITDA; its assumptions are planning estimates, not observed results.
The workbook connects attendance planning, operating costs, funding assumptions, financial statements, and decision reports rather than treating revenue as a stand-alone estimate.
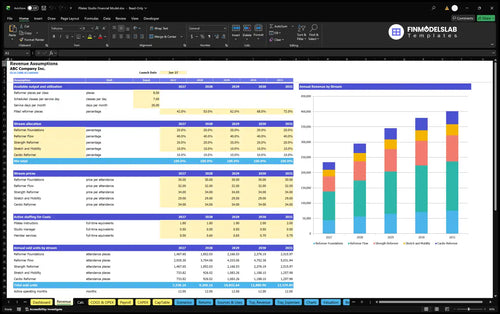
Set class capacity, annual utilization, attendance allocation, realized prices, and launch timing; the monthly calculation schedule rolls these drivers into annual studio revenue.
Keep percentage-based consumables and fees, monthly fixed studio costs, and role-based staffing separate so every base salary is charged once.
Schedule reformer equipment, fitout, and opening purchases, record equity in CapTable, and configure optional financing through Dashboard debt controls and Debt.
Review Income Statement, Cash Flow, Balance Sheet, Summary, Dashboard, Checks, Scenarios, Returns, and Valuation as separate reports with distinct financial uses.
The revenue forecast multiplies one shared pool of filled reformer places by five exclusive class shares and their realized attendance prices.
Monthly capacity is 8 reformers × 7 scheduled classes per day × 26 service days, or 1,456 available places. The example applies annual filled-place utilization of 42%, 53%, 62%, 68%, and 72% from 2026 through 2030; empty spaces earn nothing.
Attendance is allocated once: Foundations receives 20% at $30, Flow 40% at $32, Strength Reformer 20% at $34, Stretch and Mobility 10% at $29, and Cardio Reformer 10% at $34. These are realized per-attendance prices after package effects and refunds, not additional cash-pack sales.
The Revenue Forecast shows the capacity assumptions, filled places, class allocations, realized ticket prices, and revenue by stream. Its inputs feed the monthly Calc schedule, which switches revenue on in the launch month without prorating January 2026.
1,456 places × 42% filled utilization × $31.90 weighted realized price ≈ $19,507 in monthly class revenue.
Class shares sum to 100%. Annual revenue adds monthly stream results, with no material seasonal adjustment imposed.
Direct consumables, revenue-linked fees and marketing, fixed premises costs, and staff base pay are calculated as distinct expense groups.
Class consumables are modeled as 1.5% of total revenue. Payment and dispute fees are 3.5%, while local marketing falls from 5% of revenue in 2026 to 3% in 2030; none of these percentage categories includes salaried personnel.
The COGS and Operating Expenses forecast separates consumables, payment fees, marketing, and fixed overhead. Monthly fixed coverage includes rent, utilities, software, insurance, cleaning, repairs, bookkeeping, communications, licenses, and certifications.
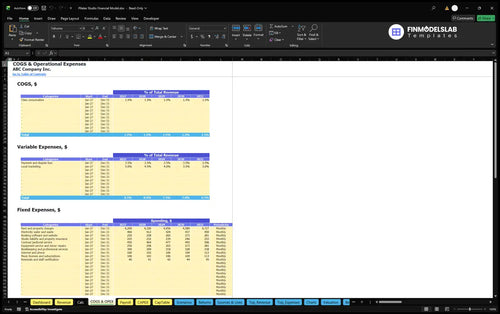
Rent starts at $4,200 per month in 2026 and reaches about $4,727 in 2030. The $75,780 fixed-cost estimate for 2026 persists when attendance underperforms.
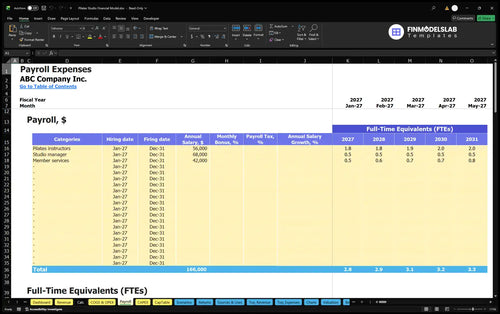
Instructors increase from 1.8 to 2.0 annual-average FTE, at $56,000 annual base per FTE. The manager remains half-time at $68,000 per full FTE, and member services increases from 0.5 to 0.75 FTE.
The Payroll Forecast links FTE plans and annual base pay to monthly personnel costs. It includes $155,800 of 2026 and $177,500 of 2030 salary expense, without duplicating pay in direct, variable, or fixed expenses.
Capital purchases, separate preopening cash items, working capital, and equity funding are planned outside the recurring operating EBITDA calculation.
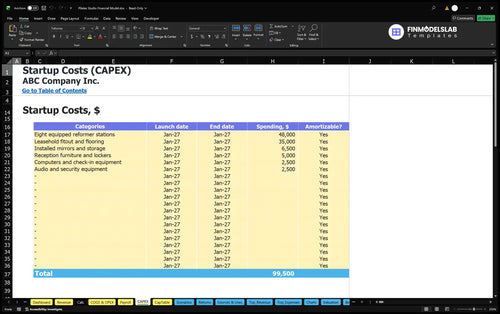
Startup assets include eight reformer stations ($48,000), fitout and flooring ($35,000), mirrors and storage ($6,500), and reception furniture and lockers ($5,000). Computers, check-in, audio, and security equipment are separate assets.
Lease deposits, permits, launch marketing, training, preopening rent, utilities, and branding are separate startup cash items.
The Capital Expenditure Plan schedules reformers, fitout, other assets, and applicable depreciation. Purchase timing feeds investment and balance-sheet schedules, not recurring EBITDA expenses.
Working-capital inputs are 0 receivable days, 0 payable days, and 30 inventory days; these do not establish cash sufficiency.
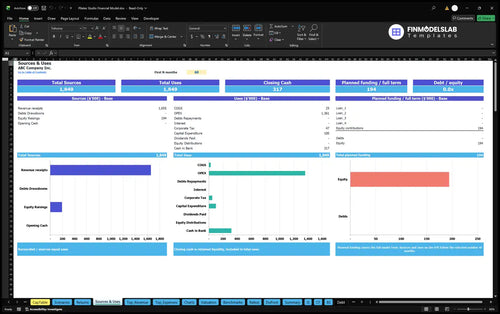
The Sources and Uses of Funds report reconciles equity, financing, operating cash flows, and investment uses. Estimated initial owner funding of $194,036 includes setup, opening working capital, and a three-month cash operating reserve.
The sample studio initially loses money at 42% filled utilization, then reaches positive EBITDA in 2027 as modeled attendance grows.
| Year | Revenue | Operating Expenses | EBITDA |
|---|---|---|---|
| 2026 | $234,090 | $254,989 | -$20,899 |
| 2027 | $295,399 | $266,116 | $29,283 |
| 2028 | $345,561 | $279,195 | $66,366 |
| 2029 | $379,003 | $290,422 | $88,581 |
| 2030 | $401,297 | $294,895 | $106,402 |
Illustrative assumptions, not actual business results; displayed figures are rounded to whole dollars and may differ slightly in arithmetic.
Annual revenue rises from $234,090 in 2026 to $401,297 in 2030 as the same eight reformers become more heavily used. That growth reflects utilization rising from 42% to 72%, not additional studios, stations, private sessions, or retail categories.
EBITDA changes from a $20,899 operating loss in 2026 to positive $29,283 in 2027 and $106,402 in 2030. EBITDA is not net income or cash flow; depreciation, financing expenses, tax assumptions, investment, and working-capital effects require separate financial statement review.
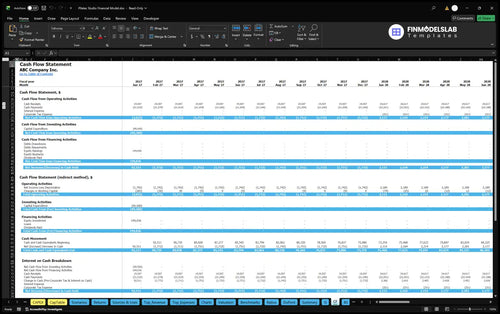
The Cash Flow Forecast tracks operating, investing, and financing cash movements, then reconciles opening and closing cash. Compare it with EBITDA to identify whether equipment purchases, member receipts, working capital, or any modeled debt repayments create funding pressure.
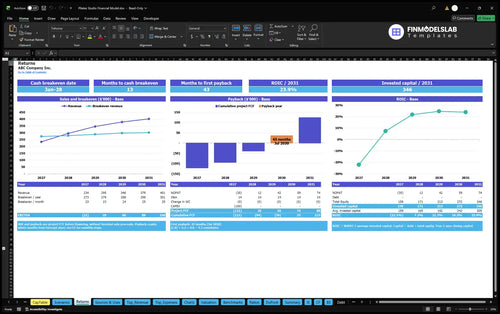
Break-even, recovery of invested cash, annual ROIC, and enterprise valuation are different calculations, not interchangeable measures of profitability.
Sales break-even measures revenue against operating costs; cash break-even concerns cash coverage. Investment payback follows cumulative project cash flow, while annual ROIC measures after-tax operating profit against invested capital, not EBITDA against startup funding.
The Returns report separately calculates sales break-even, cash break-even, payback, and annual ROIC. The supplied Pilates case does not establish payback timing or an ROIC result; inspect these outputs under your assumptions.
Dashboard Scenario Controls change revenue and cost multipliers across Low, Base, and High cases. Scenarios compares profitability, Valuation provides DCF sensitivity, and Benchmarks uses user-entered reference values.
Test whether reduced class utilization can cover rent and instructors. These reports do not guarantee profits, borrowing approval, or local market pricing.
These answers clarify the modeled class format, editable assumptions, funding example, and financial reporting boundaries.
Yes. Change reformer places, daily class slots, service days, and annual utilization to recalculate monthly attendance capacity and the related revenue streams.
No. Attendance earns its realized per-visit price, which already reflects package discounts and refunds in the supplied example.
No. The documented operating example contains five small-group reformer class formats and excludes private lessons, retail, franchising, and heated rooms.
The native launch date is January 31, 2026. Earlier months have zero revenue, and the launch month is modeled as a full operating month without daily proration.
It is an opening owner-funding assumption including startup needs and a three-month reserve, not a tested peak cash requirement or guaranteed sufficient capital.
No. EBITDA excludes investing and financing cash flows; use the Cash Flow Statement and Balance Sheet to assess cash balances and funding risk.
No. Returns, valuation, and scenarios depend on editable assumptions, and the source brief does not establish a specific payback month, ROIC, or valuation.
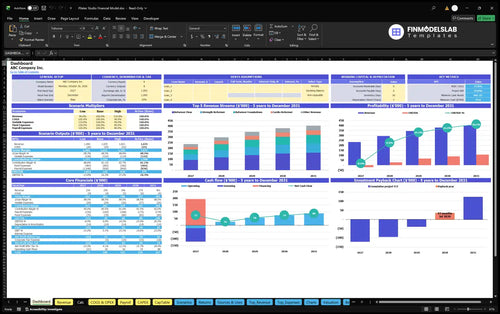
KPIs, forecasts, and cash flow at a glance.
Key assumptions and calculations driving revenue forecasts.
Funding sources, spending, and closing cash.
Cash break-even, payback, and ROIC.
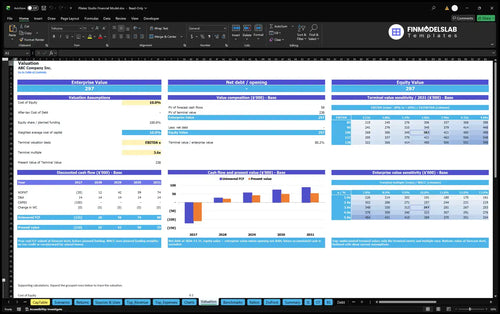
DCF valuation and sensitivity analysis.
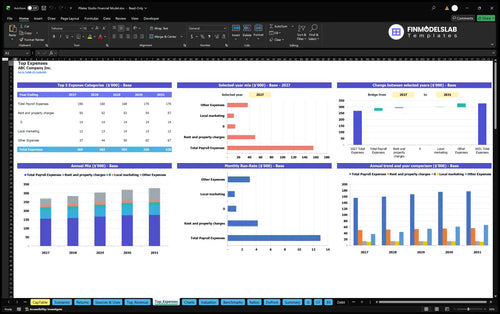
Largest costs and spending trends.
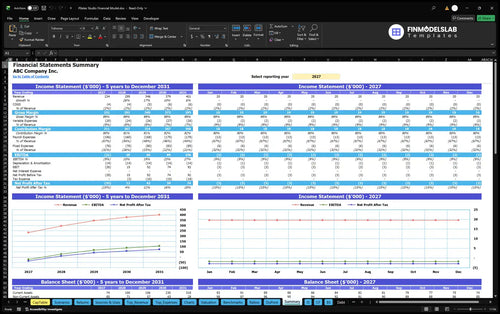
Annual and monthly financial performance.
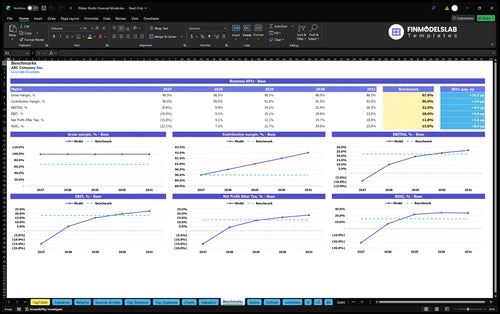
Compare margins and returns to benchmarks.

The template’s checks made it easy to trust the numbers, so one bad cell didn’t throw off the whole model. I saved about 3 hours of troubleshooting before sharing it with my lender.
I could finally see runway and shortfalls month by month without building the forecast from scratch. That made our planning call faster and got a follow-up meeting booked the same day.

Switching between low, base, and high cases was simple, and I didn’t have to rebuild three separate sheets. It cut a half-day of scenario work down to under an hour.