Editable Poke Bowl Restaurant Financial Model in Excel

Pre-built Excel model for poke bowl restaurants, with editable inputs, five-year projections, startup costs, and cash flow in a format you can use right away.
Poke Bowl Restaurant Financial Model head image summarizing the model purpose, key sections and value: helps project revenues, costs, cash runway, staffing and investor-ready forecasts for restaurant startups.
Fully Editable
Instant Download
Professional Design
Pre-Built
No Expertise Is Needed
Poke Bowl Restaurant Financial Model head image summarizing the model purpose, key sections and value: helps project revenues, costs, cash runway, staffing and investor-ready forecasts for restaurant startups.
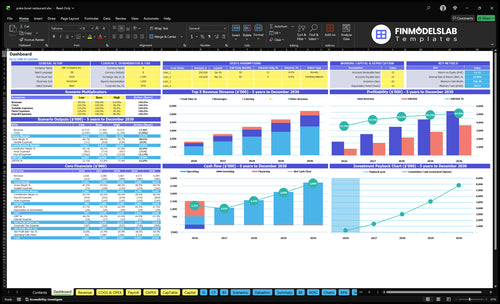
Poke Bowl Restaurant Financial Model dashboard summarizing key KPIs, runway and cash position with a dynamic dashboard for performance monitoring, investor-ready charts and quick cash-flow visibility
Poke Bowl Restaurant Financial Model ROIC calculation and charts showing return on invested capital, capital efficiency and payback timing to assess investment profitability and improve investor-ready clarity.
Poke Bowl Restaurant Financial Model break-even calculation and charts showing sales volume and revenue thresholds to cover fixed and variable costs, helping test pricing and timing to avoid cash-flow blind spots
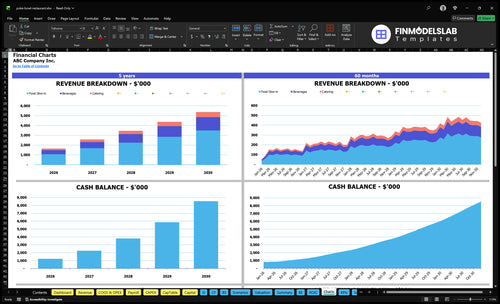
Poke Bowl Restaurant Financial Model financial charts visualizing revenue, margins, cash burn, and growth trends to report key metrics for stakeholders with polished, dynamic KPI visuals.
Poke Bowl Restaurant Financial Model ratios tab showing key financial ratios (liquidity, profitability, efficiency) to assess performance, benchmark returns and clarify drivers for investors.
Poke Bowl Restaurant Financial Model valuation section showing DCF and exit valuation analysis that estimates business value, investor-ready outputs and clarity on return drivers and assumptions.
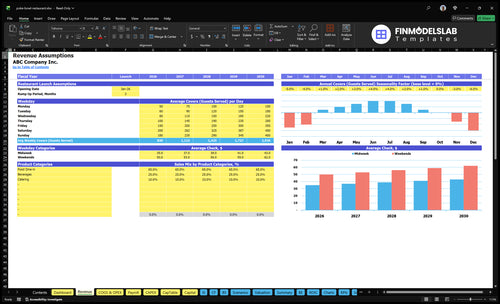
Poke Bowl Restaurant Financial Model revenue inputs tab showing customizable sales drivers, pricing tiers, customer counts and seasonality to model revenue streams and test growth assumptions.
Poke Bowl Restaurant Financial Model COGS & opex inputs allowing customization of ingredient costs, supplier margins, rent, utilities and operating expenses to model margins, cash flow and break-even.
Poke Bowl Restaurant Financial Model capex inputs detailing startup and ongoing capital expenditures, letting users customize equipment, fit-out, and investment timing for accurate cash needs and funding plans.
Poke Bowl Restaurant Financial Model payroll inputs showing staffing levels, wages, benefits and hiring timelines so users can customize labor costs, model headcount scenarios and forecast payroll-driven cash flow.
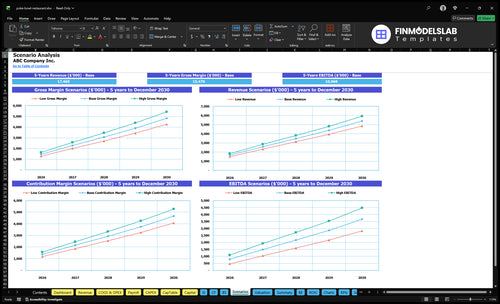
Poke Bowl Restaurant Financial Model scenarios charts compare low, base and high forecasts to test demand, margins and funding needs, helping founders avoid weak scenario testing and plan runway.
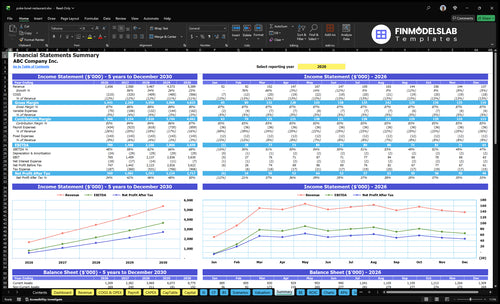
Poke Bowl Restaurant Financial Model financial summary showing consolidated P&L, cash flow runway and balance sheet snapshot to assess profitability, liquidity and funding needs for investors.
Poke Bowl Restaurant Financial Model income statement report showing automated P&L projections and margins over time, delivering clear revenue, COGS, gross profit and operating expense breakdown for investor-ready forecasting and to reveal profitability timing.
Poke Bowl Restaurant Financial Model cash flow report showing projected cash inflows, outflows and runway; delivers automated cash flow statements to identify liquidity timing and cash‑flow blind spots for investors
Poke Bowl Restaurant Financial Model balance sheet report showing assets, liabilities and equity positions to assess solvency and net worth, supporting investor-ready clarity and liquidity planning.
Poke Bowl Restaurant Financial Model top expenses report showing major cost categories and trends, helping owners understand key cost drivers, optimize spending and improve margin visibility for investors
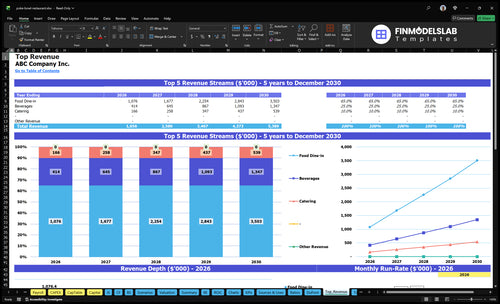
Poke Bowl Restaurant Financial Model top revenue report showing revenue breakdown by menu items, channels and growth drivers to identify best-selling lines and support investor-ready forecasts and pricing decisions
Poke Bowl Restaurant Financial Model sources & uses report showing funding plan, allocation of capital and startup costs to uses and sources to clarify financing needs and investor expectations
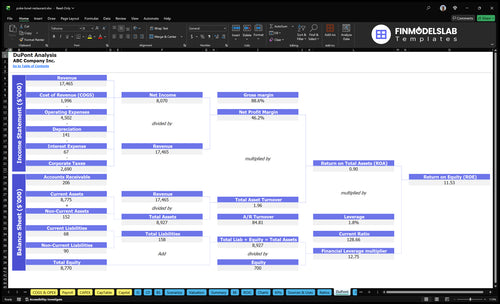
Poke Bowl Restaurant Financial Model DuPont report showing return-on-equity drivers, margin, efficiency and leverage breakdown to clarify profitability drivers and investor-ready performance metrics
Poke Bowl Restaurant Financial Model captable inputs and calculations showing equity ownership, investor rounds, dilution and share classes; lets users customize founders, investors, and funding assumptions for scenario-ready ownership planning
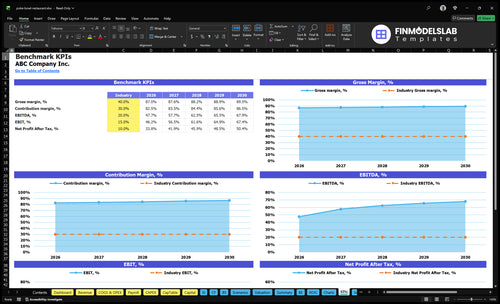
Poke Bowl Restaurant Financial Model KPI charts showing visualized metrics—revenue growth, margins, customer throughput and cash runway—for stakeholder reporting and polished performance tracking.
Fully Editable
Instant Download
Professional Design
Pre-Built
No Expertise Is Needed
Poke Bowl Restaurant Bundle
See included products:
Financial Model iPoke Bowl Restaurant Bundle Financial Model template included in this product.
$149 $109
ADD TO YOUR ORDER
Business Plan iPoke Bowl Restaurant Bundle Business Plan template included in this product.
$79 $59
Pitch Deck iPoke Bowl Restaurant Bundle Pitch Deck template included in this product.
$49 $29
YOU SAVE $0 TODAY
30-Day Money-Back Guarantee
Created by a Former CFO
Updated for 2026
One-Time Purchase
Description
MODEL OVERVIEW

What Is the Poke Bowl Restaurant Financial Model?

This editable five-year Excel and Google Sheets workbook forecasts poke bowl restaurant revenue from weekday covers, seasonality, average checks, and sales mix, then connects operating assumptions to financial reports.

Use the workbook to translate poke bowl restaurant traffic, pricing, sales mix, costs, staffing, and capital assumptions into a structured forecast of revenue, profitability, cash flow, and financial position.

Edit the opening date, weekday covers or orders, operating calendar, monthly seasonality, midweek and weekend checks, revenue mix, costs, staffing, and capital assumptions; linked calculations update the reports.

Built around restaurant traffic The model starts with weekday cover or order patterns and average checks rather than a single top-line sales input.
POKE BOWL RESTAURANT REVENUE ENGINE

How Does the Poke Bowl Restaurant Financial Model Calculate Revenue?

Revenue starts with average covers or orders by weekday, converts them through the operating calendar and monthly seasonality, applies midweek or weekend checks, then allocates and totals category sales.

01

Weekday Covers

Forecast average covers or orders for each day of the operating week.

02

Operating Calendar

Convert daily patterns into monthly volume using operating days, weeks, opening timing, and closures.

03

Seasonality

Apply monthly seasonality to the resulting cover or order volume.

04

Checks & Mix

Apply midweek and weekend average checks, then allocate sales across revenue categories.

05

Total Revenue

Sum monthly category sales together with any separately modeled ancillary revenue.

CORE FORMULA Revenue = Covers × Average check
01 / REVENUE ASSUMPTIONS

Where Do You Set Covers, Checks, and Revenue Mix?

The Revenue Assumptions view centralizes opening timing, weekday cover forecasts, monthly seasonality, midweek and weekend checks, and the sales mix used by the forecast.

Poke Bowl Restaurant Financial Model Revenue Assumptions worksheet with opening timing, weekday covers, monthly seasonality, average checks, and product sales mix REVENUE ASSUMPTIONS
Revenue view showing cover assumptions, seasonality, average checks, and product category mix.
02 / COGS & OPEX

How Are Costs and Operating Expenses Structured?

The COGS & OPEX sheet separates direct costs, variable expenses, and fixed operating costs so monthly projections respond to editable cost assumptions.

Poke Bowl Restaurant Financial Model COGS and OPEX worksheet with direct costs, variable expenses, fixed expenses, timing, and monthly calculations COGS & OPEX
COGS & OPEX view showing direct, variable, and fixed expense schedules.
03 / SCENARIO ANALYSIS

How Can You Compare Low, Base, and High Cases?

The Scenario Analysis view compares Low, Base, and High outcomes across revenue, gross margin, contribution margin, and EBITDA over the five-year forecast.

Poke Bowl Restaurant Financial Model Scenario Analysis worksheet comparing Low Base and High revenue, gross margin, contribution margin, and EBITDA cases SCENARIO ANALYSIS
Scenario Analysis view comparing Low, Base, and High revenue, margin, and EBITDA paths.
04 / DASHBOARD

What Does the Dashboard Bring Together?

The Dashboard combines scenario controls, key metrics, core financials, revenue mix, cash flow, profitability, and payback charts in one management view.

Poke Bowl Restaurant Financial Model Dashboard with scenario controls, key metrics, core financials, revenue mix, profitability, cash flow, and payback charts DASHBOARD
Dashboard view combining scenario settings, financial outputs, cash flow, and profitability charts.
PRODUCT FIT

Is the Poke Bowl Restaurant Financial Model Right for You?

It fits businesses using shared cover or order volumes and average checks; custom modeling may suit operations with materially different revenue structures or schedules.

READY-MADE MODEL

A Good Fit

  • Your sales are driven by shared daily covers or orders and average checks.
  • You want weekday patterns, closures, and monthly seasonality reflected in the forecast.
  • You need separate midweek and weekend check assumptions with category mix allocation.
  • You want restaurant costs, payroll, capital spending, scenarios, and financial reports linked in one workbook.
CUSTOM STRUCTURE

Consider Custom Modeling

  • Your revenue depends on separate customer cohorts, contracts, subscriptions, or other mechanics outside the shared cover base.
  • You need multiple locations or operating units modeled with distinct calendars and revenue engines.
  • You require specialized cost, staffing, financing, or capital schedules beyond the template structure.
  • You need different reporting layouts or decision outputs tailored to a specific transaction or operating process.

The template is a planning starting point, not a guarantee of performance.

CUSTOM FINANCIAL MODELING SERVICE

Need a Model Built Around Your Requirements?

Financial Models Lab can build or adapt a model when your business requires different revenue logic, operating schedules, or reporting than the ready-made workbook.

ORDER A CUSTOM FINANCIAL MODEL
AFTER CHECKOUT

What You Receive

After checkout, you receive the fully editable Poke Bowl Restaurant Financial Model for five-year monthly and annual forecasting with scenario and financial reporting views.

01

Editable workbook

Use the pre-built Excel and Google Sheets-compatible model and replace planning assumptions with your own.

02

5-Year forecast

Project the business across five years with monthly and annual financial detail.

03

Scenario analysis

Compare Low, Base, and High cases using the workbook's scenario controls.

04

Financial reports

Review the income statement, cash flow, balance sheet, summary, dashboard, and related reports.

BEFORE YOU BUY

Poke Bowl Restaurant Financial Model FAQ

The essential answers are visible in full, with no accordion clicks required.

01

How does the Poke Bowl Restaurant Financial Model calculate revenue?

It forecasts covers or orders by weekday, adjusts them for operating days and seasonality, applies midweek or weekend average checks, then allocates and totals category sales.

02

Which assumptions can I change?

You can change the opening date, weekday covers or orders, operating days and weeks, closures, monthly seasonality, midweek and weekend checks, revenue mix, and ancillary sales.

03

What can I compare in the Low, Base, and High scenarios?

The Scenario Analysis view compares alternative cases across revenue, gross margin, contribution margin, and EBITDA over the five-year forecast.

04

Which financial outputs are included?

The workbook includes the dashboard, income statement, cash flow, balance sheet, summary, break-even, scenario, charts, KPI, and additional reporting views shown in the gallery.

05

Can Financial Models Lab adapt the model to custom requirements?

Yes. Financial Models Lab offers custom financial modeling when you need different revenue logic, operating schedules, or reporting.

06

Is the Poke Bowl Restaurant workbook a forecast or a guarantee?

It is a planning forecast driven by editable assumptions, not a guarantee of future performance.

What Does the Poke Bowl Restaurant Financial Model Contain?

This pre-written financial model for a food service startup includes everything from revenue forecasting to a detailed profit and loss statement, all in one downloadable file.
poke bowl restaurant financial model dashboard financialmodelslab

All-in-one Dashboard

Core inputs and core outputs

poke bowl restaurant financial model scenarios financialmodelslab

Low/Base/High

Three scenario analysis

poke bowl restaurant financial model charts financialmodelslab

Professional Charts

Presentation ready

poke bowl restaurant financial model dupont financialmodelslab

ROE Components

DuPont analysis

poke bowl restaurant financial model revenue financialmodelslab

Revenue Inputs

Researched revenue assumptions

poke bowl restaurant financial model summary financialmodelslab

Bank-Ready Reports

Lender-friendly financial outputs

poke bowl restaurant financial model top revenue financialmodelslab

Revenue Breakdown

Revenue stream detailed view

poke bowl restaurant financial model kpis financialmodelslab

KPI Dashboard

Performance metrics benchmark

Trusted by 25,000+ startup founders, investors and CPAs

Blank-Sheet Relief

Megan Hart, TX

4 star rating

I didn’t know where to start, and this template got me moving fast. I had a working first draft in under an hour instead of staring at a blank spreadsheet all day.

Clear Break-Even View

Daniel Reed, CA

5 star rating

The margin and break-even tabs made the numbers easy to follow. I booked a meeting with our partner team the same day because I could finally explain where profit starts.

Simple Assumptions Setup

Lauren Collins, FL

4 star rating

My pricing, cost, and growth inputs were all over the place before this. Now everything sits in one place, and I cut my planning time by half.