

Define Streams
Set each revenue stream independently, including its name and launch timing when applicable.


This editable five-year workbook models independent poker-room visit and admission streams, matching prices, seasonality, ancillary income, costs, scenarios, and financial reports.
Use it to translate poker-room traffic assumptions, stream-specific ticket or visit prices, seasonality, ancillary entertainment income, and operating costs into a structured financial forecast.
Editable revenue, cost, staffing, capital, scenario, and financing inputs flow through linked statements and management reports as assumptions change.
Each entertainment stream forecasts its own visit or admission volume and price, applies seasonality once when needed, then adds enabled ancillary income.
Set each revenue stream independently, including its name and launch timing when applicable.
Enter annual or monthly admissions, visits, tickets, attendees, sessions, or comparable transaction volume for each stream.
Assign the matching ticket, visit, admission, ride, or session price to each forecast stream.
Allocate annual stream revenue through monthly seasonality once and include separately entered ancillary entertainment income once.
Multiply each stream’s volume by its matching price, then sum all stream revenue and enabled ancillary income.
The Revenue sheet organizes stream volumes, launch dates, prices, monthly seasonality, and separate ancillary income before calculating total poker-room revenue.
 REVENUE
The COGS & OPEX sheet separates direct COGS, variable expenses, and fixed expenses with annual assumptions feeding monthly forecast calculations.
 COGS & OPEX
The Scenarios view compares Low, Base, and High revenue, gross margin, contribution margin, and EBITDA trajectories across the five-year forecast.
 SCENARIOS
The Dashboard combines model setup, scenario controls, key metrics, financial summaries, revenue mix, profitability, cash flow, and payback reporting in one view.
 DASHBOARD
The ready-made model fits independent visit-, ticket-, admission-, or session-driven revenue streams; materially different revenue logic or operating schedules may require custom modeling.
The template is a planning starting point, not a guarantee of performance.
Financial Models Lab can build or adapt a model when you need different revenue logic, operating schedules, or financial reporting.
ORDER A CUSTOM FINANCIAL MODELYou receive an instantly downloadable, editable Excel workbook compatible with Google Sheets, with five-year projections, scenarios, statements, and management reporting.
Update revenue-stream names, launch dates, activity volumes, prices, seasonality, ancillary income, costs, staffing, and capital assumptions.
Review five years of projections with monthly forecast detail and annual financial reporting.
Compare Low, Base, and High cases across revenue and profitability measures.
Use linked income statement, cash flow, balance sheet, summary, dashboard, and management views.
The essential answers are visible in full, with no accordion clicks required.
It multiplies each independent stream’s visit, ticket, admission, or comparable volume by its matching price, then adds enabled ancillary entertainment income once.
You can edit revenue-stream names, applicable launch dates, annual or monthly activity volumes, matching prices, monthly seasonality, and separately entered ancillary entertainment income.
You can compare alternative Low, Base, and High trajectories for revenue, gross margin, contribution margin, and EBITDA across the five-year projection.
The workbook includes dashboard, summary, income statement, cash flow, balance sheet, break-even, ROIC, charts, ratios, valuation, and additional management reports.
Yes. Financial Models Lab can build or adapt a model when your revenue logic, operating schedules, financing mechanics, or reporting requirements differ from the ready-made structure.
It is an editable financial forecast based on assumptions, not a guarantee of business performance or financial results.
This downloadable poker room budget template comes with everything you need for comprehensive financial planning, from a dynamic dashboard to detailed financial statements.

Core inputs and core outputs

Three scenario analysis

Presentation ready
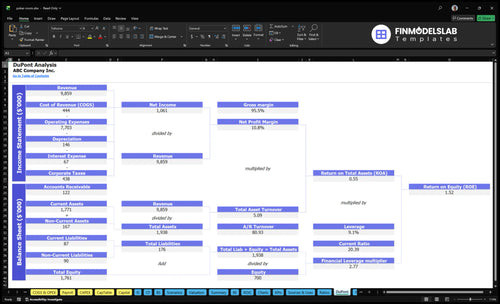
DuPont analysis
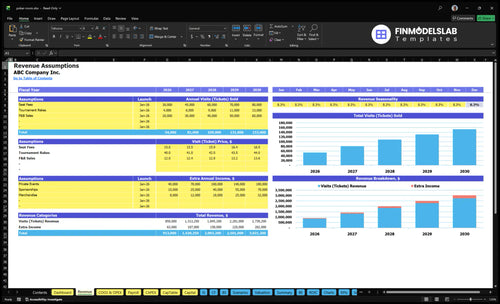
Researched revenue assumptions
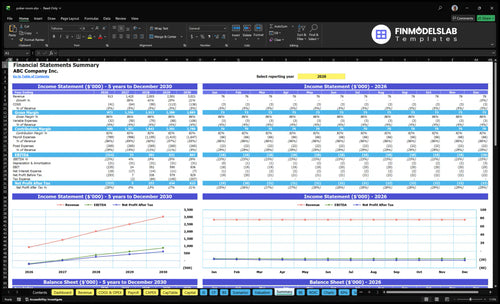
Lender-friendly financial outputs
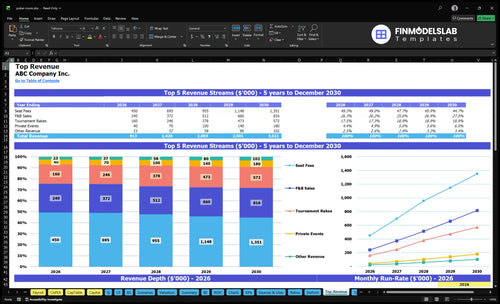
Revenue stream detailed view

Performance metrics benchmark

I’m not an Excel person, and this template made the advanced parts easy to follow. I saved a full day of trial and error and could explain the model without getting lost in formulas.
I was stuck staring at a blank workbook, so this was a relief. The pre-built structure helped me get a first draft done in under an hour instead of spending the whole morning starting over.

My pricing, cost, and growth ideas were all over the place before I used this. Having everything laid out in one model made the assumptions easier to track and cut my planning time by several hours.