

Revenue & Calc
Edit visitor traffic, conversion, items per sale, product mix, prices, and seasonality. Calc produces monthly items sold and revenue by category.


The Pop-Up Shop Financial Model is an Excel template for a recurring gift-and-accessories store. It links traffic, conversion, product mix, prices, merchandise costs, staffing, and initial funding to five-year projections.
The illustrated 500-square-foot shop rotates quarterly among mid-cost U.S. neighborhood spaces. Its 2026–2030 forecast assumes 20 trading days monthly and demand-driven sales without a store-capacity cap.
The workbook links retail assumptions and monthly calculations with financial statements, financing controls, and decision-focused reports.
Edit visitor traffic, conversion, items per sale, product mix, prices, and seasonality. Calc produces monthly items sold and revenue by category.
Plan merchandise, freight, packaging, stock loss, payment fees, advertising, temporary overhead, and role-based salaries without double-counting payroll.
Record reusable equipment, startup assets, equity contributions, and optional debt facilities with repayment schedules.
Review the Income Statement, Cash Flow, Balance Sheet, combined Summary, sales mix, and selected-scenario metrics.
Explore break-even, payback, ROIC, Low/Base/High cases, and workbook reconciliation checks.
Revenue starts with entering shoppers, converts them into purchases, and prices the items sold across five merchandise categories.
Monthly item demand equals trading days times visitors per day, purchasing conversion, and items per purchase, adjusted for seasonality. That demand is distributed among categories without a separate sales-capacity ceiling.
The item mix is 25% candles, 20% jewelry, 20% tote bags, 15% art prints, and residual 20% ceramics. Each category earns items sold times its annual unit price.
The Revenue Forecast presents visitor demand, product mix, prices, and category sales. Compare how conversion, traffic, or merchandise allocation changes projected revenue.

20 days × 150 visitors × 22% conversion × 1.4 items = 924 items; 924 × $31.80 weighted item price ≈ $29,383 in sales.
Seasonal factors total 12.0 in 2026, with 0.8 in January and February and 1.5 in December. Illustrated annual sales reach $352,598, not historical results.
Although launch is January 31, 2026, January counts as a full operating month; prelaunch sales are zero.
Direct and sales-linked costs scale with revenue, while temporary rent, support expenses, and base staffing follow separate schedules.
Direct costs total 53% of revenue: merchandise 48%, freight 2.5%, packaging 1.2%, and stock loss 1.3%. Variable costs add 3% processing and 2.5% advertising.
Fixed expenses cover rent, utilities, insurance, software, storage, administration, fixture moves, and maintenance. Example 2026 rent is $4,000 monthly for 12 paid months; total annual fixed costs are $68,100.
The COGS and Operating Expenses report distinguishes direct merchandise costs, variable spending, and fixed overhead. Edit its rates and monthly amounts to test projected margins.

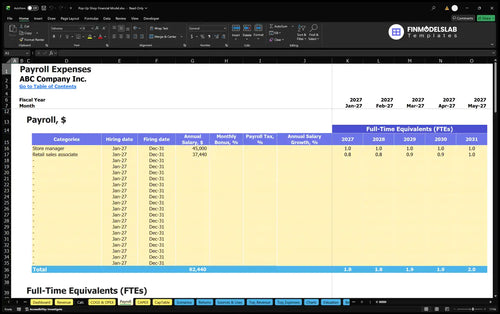
In 2026 staffing is one manager plus 0.75 associate FTE. At $45,000 per manager and $37,440 per associate FTE, annual payroll is $73,080; with 1.0 associate FTE, 2030 payroll is $82,440.
The Payroll Forecast schedules role-based FTE, annual salaries, and employment dates. Monthly personnel costs flow to the statements separately from merchandise and operating overhead.
The model keeps reusable assets, other opening cash needs, working capital, and owner funding distinct from ongoing operating earnings.
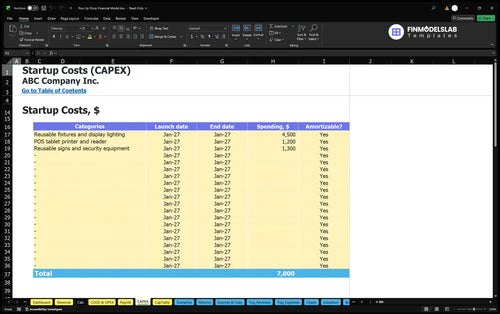
Assets include $4,500 fixtures and lighting, $1,200 POS equipment, and $1,300 signage and security: $7,000 total. Separate opening cash covers deposits, permits, launch marketing, decor, and preopening wages.
The Capital Expenditure Plan records asset purchases, timing, and depreciation treatment. It separates investment in movable displays and POS hardware from recurring shop expenses.
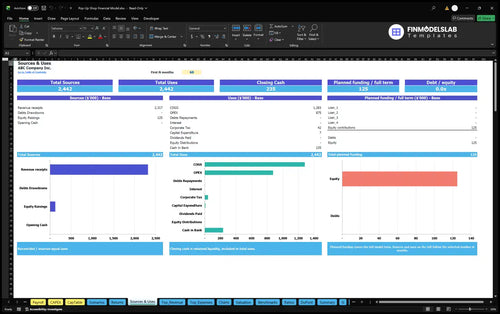
Working capital assumes zero receivable days, zero payable days, and 45 inventory days. Initial owner funding of $124,777 reflects opening assets, other launch cash, net working capital, a three-month reserve, and funding offsets.
No extra deficit buffer is built into this opening funding estimate. Adjust inventory, deposits, assets, and contributions before evaluating liquidity.
The Sources and Uses of Funds report reconciles equity, debt, investment, payments, and retained cash. It keeps owner contributions distinct from merchandise revenue.
The example operating forecast shows sales growth and rising EBITDA as visitor conversion, traffic, and annual selling prices change.
| Year | Revenue | Operating Expenses | EBITDA |
|---|---|---|---|
| 2026 | $352,598 | $347,450 | $5,148 |
| 2027 | $404,997 | $382,018 | $22,979 |
| 2028 | $462,487 | $419,626 | $42,861 |
| 2029 | $525,428 | $460,486 | $64,942 |
| 2030 | $571,224 | $493,253 | $77,971 |
Illustrative model outputs, not observed business results; displayed amounts are rounded independently to whole dollars.
Revenue increases from $352,598 in 2026 to $571,224 in 2030, while EBITDA rises from $5,148 to $77,971. EBITDA margins are approximately 1.5% and 13.6%.
EBITDA excludes interest, taxes, depreciation, and amortization; it is not net profit or cash. The Income Statement, Balance Sheet, and Cash Flow Statement address those separate perspectives.
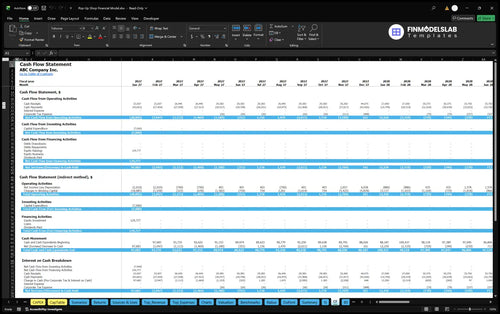
The Cash Flow Forecast reconciles operating, investing, and financing activity to closing cash. Evaluate inventory, equipment purchases, equity funding, and debt payments here rather than relying on EBITDA for liquidity.
The Returns and scenario reports evaluate distinct operating and investment questions beyond the example EBITDA projection.
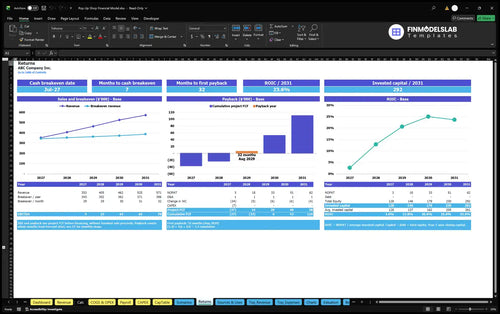
Sales break-even concerns the revenue needed to cover operating costs; cash break-even considers when cash balances cover requirements. Payback tracks invested-fund recovery, while annual ROIC relates returns to invested capital.
Dashboard Scenario Controls set Low, Base, and High multipliers for revenue, direct costs, variable costs, fixed costs, and payroll. Compare profitability across cases.
The Returns report covers sales break-even, cash break-even, investment payback, and annual ROIC. Positive illustrative EBITDA does not establish a payback month or ROIC.
It is suited to evaluating one rotating gift-and-accessories storefront with demand-driven sales and recurring monthly operating commitments.
Evaluate traffic, conversion, merchandise mix, pricing, rotating locations, rent, and staffing. Replace the estimated inputs with your own observations and costs.
Benchmarks compare projected KPIs with user-entered reference values; Valuation provides DCF and terminal sensitivities. Neither establishes an industry average or guaranteed valuation.
Answers to common questions about inputs, forecasting mechanics, funding, and financial reports.
Yes. Edit the trading days, entering visitors, purchasing conversion, and items per purchase to recalculate demand-driven sales.
The five product groups are candles, jewelry, tote bags, art prints, and ceramics, each with a share of sold items and annual selling prices.
No. The documented calculation is demand-based and does not impose a separate capacity ceiling on monthly sales.
Yes. The Revenue inputs use a repeating 12-month set of seasonal multipliers, including an elevated December factor in the illustrative case.
No. The documented fixed base salaries are included in Payroll, separately from direct costs, variable expenses, and fixed operating expenses.
Yes. Assets, other opening cash needs, working capital, and owner contributions are separate from recurring merchandise revenue and operating EBITDA.
Yes. It includes the Income Statement, Cash Flow Statement, Balance Sheet, and a combined Summary, alongside forecasting and financing schedules.
No. Operating EBITDA is not cash flow, and investment payback and ROIC require their own calculations and assumptions.
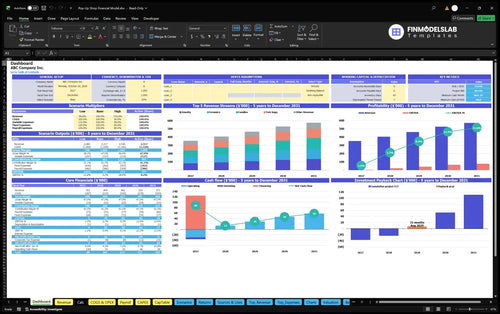
KPIs, forecasts, and cash flow at a glance.
Key assumptions and calculations driving revenue forecasts.
Funding sources, spending, and closing cash.
Cash break-even, payback, and ROIC.
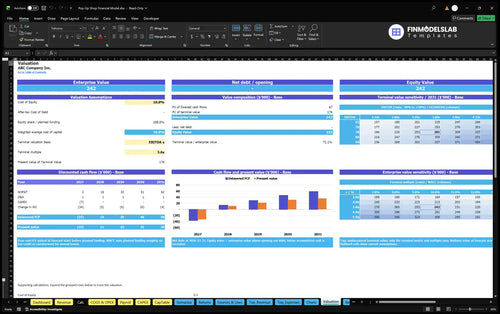
DCF valuation and sensitivity analysis.

Largest costs and spending trends.
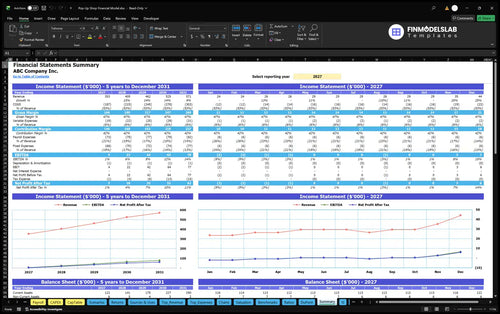
Annual and monthly financial performance.
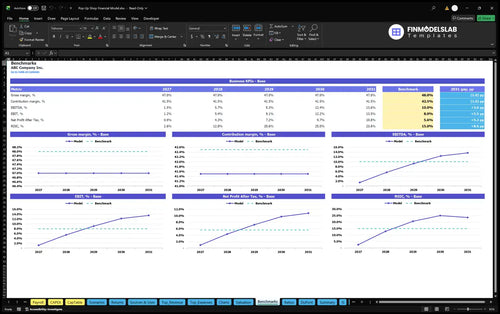
Compare margins and returns to benchmarks.

The low, base, and high cases were a mess before this template. I saved hours setting up our pop-up shop forecast and could finally compare assumptions side by side.
I used to dig through separate files for statements and charts. Now everything is in one model, and I had a clean update ready for our meeting in under an hour.

I’m not great with advanced Excel, but this template kept the hard parts out of my way. I filled in the inputs, understood the logic, and booked a planning call the same day.