

Acquire Customers
Calculate new customers separately by channel as marketing spend ÷ CAC, then add online and offline customers.


This editable five-year Excel and Google Sheets workbook models monthly portable solar charger sales from acquisition, repeat customers, product mix, pricing, and financial reports.
Use the workbook to translate marketing budgets, channel CAC, repeat-customer behavior, order volume, product mix, and prices into a five-year portable solar charger forecast.
Editable assumptions flow through revenue, COGS and operating expenses, scenarios, and linked financial statements so changes can be reviewed across the model.
The model calculates customers by acquisition channel, builds repeat-buyer cohorts, converts monthly orders to units, allocates product mix, and applies category prices.
Calculate new customers separately by channel as marketing spend ÷ CAC, then add online and offline customers.
A percentage of new customers becomes repeat buyers, and each cohort remains active for its stated lifetime.
Monthly orders equal new-customer first purchases plus active repeat customers × average repeat orders per month.
Units sold equal total orders × average units per order, then sales mix allocates units across categories.
Category revenue equals allocated units × category price, then categories and months sum into total ecommerce revenue.
The Revenue sheet links channel acquisition inputs, repeat-customer behavior, order and unit drivers, charger-category sales mix, and annual prices to the forecast.
 REVENUE
The COGS & OPEX sheet separates product purchase costs, packaging, variable selling and fulfillment expenses, and recurring fixed operating expenses across the monthly forecast.
 COGS & OPEX
The Scenarios view compares Low, Base, and High trajectories for revenue, gross margin, contribution margin, and EBITDA across the five-year forecast.
 SCENARIOS
The Dashboard combines scenario controls, core financials, revenue mix, profitability, cash flow, investment payback, working capital, and key metrics in one view.
 DASHBOARD
It fits portable solar charger businesses using this acquisition-to-repeat-order-to-product revenue logic; materially different operating mechanics or reporting structures may warrant custom modeling.
The template is a planning starting point, not a guarantee of performance.
Financial Models Lab can build or adapt a model when you need different revenue logic, operating schedules, or reporting from the ready-made structure.
ORDER A CUSTOM FINANCIAL MODELAfter checkout, you receive the editable Portable Solar Chargers Financial Model for instant download and use in Excel or Google Sheets.
Download the editable model and replace the supplied assumptions with your own planning inputs.
Plan five years of projections with monthly and annual financial detail.
Compare Low, Base, and High cases through the built-in scenario view.
Review the income statement, cash flow, balance sheet, Dashboard, Scenarios, and Summary.
The essential answers are visible in full, with no accordion clicks required.
It calculates new customers by marketing channel, adds repeat-customer orders, converts orders to units, allocates units by product mix, and applies category prices.
You can change launch date, channel budgets and seasonality, CAC, repeat-customer share and lifetime, repeat order frequency, units per order, sales mix, and category prices.
The Scenarios view compares revenue, gross margin, contribution margin, and EBITDA across Low, Base, and High cases.
Outputs include the Dashboard, Summary, Income Statement, Cash Flow, Balance Sheet, Break-Even, ROIC, Valuation, Charts, KPIs, and Ratios.
Yes. Financial Models Lab offers custom financial modeling when you need different revenue logic, operating schedules, or reporting structures.
It is a planning forecast based on editable assumptions, not a guarantee of business performance or financial results.
You get a comprehensive financial toolkit designed to guide your portable solar charger business from launch to scale.
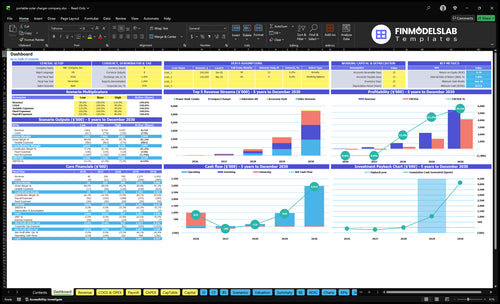
Core inputs and core outputs
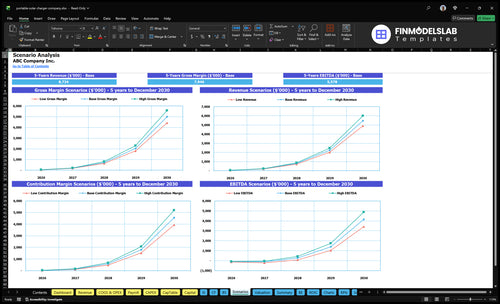
Three scenario analysis
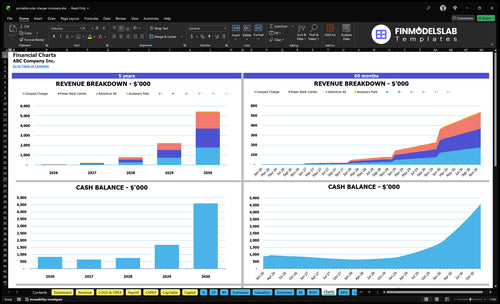
Presentation ready
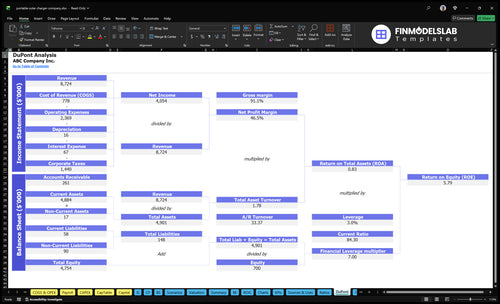
DuPont analysis
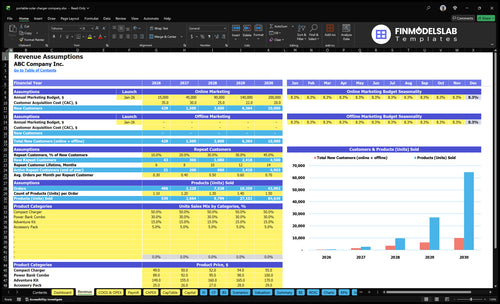
Researched revenue assumptions
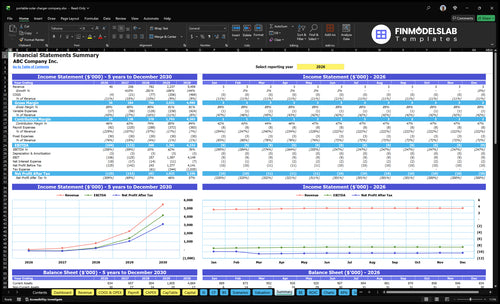
Lender-friendly financial outputs
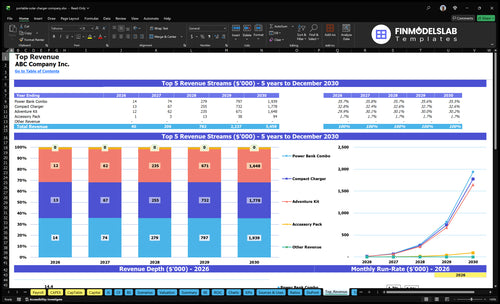
Revenue stream detailed view
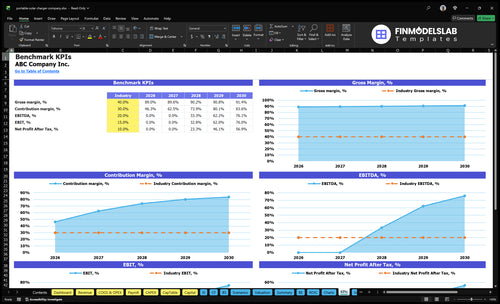
Performance metrics benchmark

I could finally see the margin and break-even picture without rebuilding the whole sheet. It saved me hours and made the launch assumptions much easier to explain.
The structure showed me exactly what to include for investor conversations, so I wasn’t guessing at the output. I booked a meeting faster because the model already looked organized and ready to share.
I used to worry one bad formula would throw off the whole model, but this template kept things clean and easy to follow. That peace of mind saved me a full afternoon of checks.