

Revenue & Calc
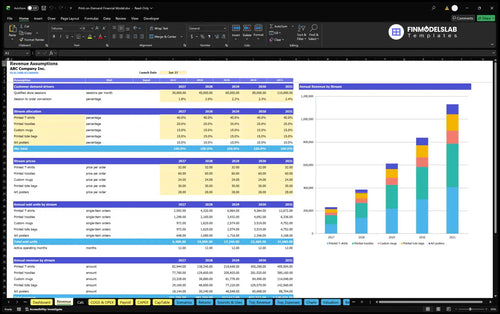
Revenue holds the five selling prices, order allocations, sessions, conversion and launch inputs. Calc turns them into a monthly revenue forecast, allocating the same accepted-order pool once across product categories.


The Print-on-Demand Store Financial Model is an Excel template for forecasting a U.S. direct-to-consumer gift store selling original designs through Shopify. It converts qualified store sessions, accepted-order conversion, category mix and selling prices into monthly sales and 2026–2030 financial projections.
The illustrative operation is home-office based in Columbus, Ohio, with U.S. printing and domestic shipping outsourced. Every accepted order contains one item; the model assumes no warehouse, imported fulfillment, in-house manufacturing equipment or separate production-capacity limiter.
The workbook links editable operating assumptions to monthly calculations, financial statements, financing schedules and management reports, so a store owner can examine how changes affect projected outcomes.
Revenue holds the five selling prices, order allocations, sessions, conversion and launch inputs. Calc turns them into a monthly revenue forecast, allocating the same accepted-order pool once across product categories.
COGS & OPEX separates supplier printing and shipping from sales-dependent charges and fixed costs. Payroll plans salaries by role and FTE so compensation does not also appear in other expense groups.
The Income Statement projects margins and earnings; Cash Flow, Balance Sheet and Summary support broader reporting. Dashboard shows selected-case measures, while the supplied operating example documents results only through EBITDA.
CapTable, CAPEX, Debt and Sources & Uses organize contributions, durable assets, optional loan facilities and funding allocation. Checks highlights reconciliation and input issues without guaranteeing sufficient cash.
Monthly qualified Shopify sessions multiplied by accepted-order conversion determine orders; those orders are split among five product categories and multiplied by their net selling prices.
The Base case assumes 30,000 monthly sessions at a 1.8% conversion rate in 2026, increasing to 110,000 sessions and 2.4% conversion in 2030. The launch month is a full normal operating month, and the case adds no seasonal sales uplift.
Prices and the order mix are constant in the example. Changing either affects the weighted selling price; changing monthly sessions or conversion affects the shared order count, not five independent sets of customers.
| Product category | Net price | Order share |
|---|---|---|
| Printed T-shirts | $32 | 40% |
| Printed hoodies | $60 | 20% |
| Custom mugs | $24 | 15% |
| Printed tote bags | $30 | 15% |
| Art posters | $28 | 10% |
Mix totals 100%; the example weighted selling price is $35.70 per accepted order.
30,000 monthly sessions × 1.8% conversion × $35.70 weighted price × 12 months = $231,336 annual revenue.
The Revenue Forecast connects traffic, accepted orders, product allocation and selling prices with monthly and annual sales. It helps test whether traffic growth, conversion improvements or a changed product mix drives the revenue target.
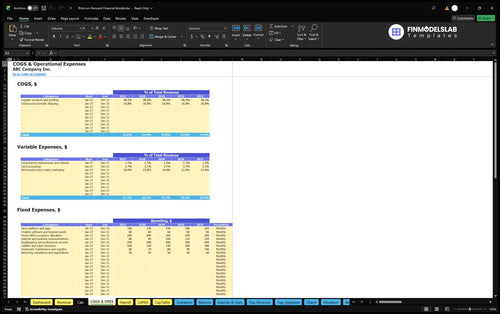
Operating expenses are built from supplier and shipping costs, other revenue-linked charges, monthly overhead and separately calculated fixed payroll.
Estimated direct costs equal 38.24% of revenue for supplier products and printing plus 16.81% for outsourced domestic shipping. Additional variable rates include 1.5% for unrecovered replacements and refunds, 3.74% for card processing, and marketing declining from 16% in 2026 to 13% in 2030.
Fixed overhead covers store platform and apps, creative tools, home-office allocation, communications, bookkeeping, insurance, supplies and registrations. For example, the store platform and apps budget rises from $100 per month in 2026 to $220 per month in 2030.
The COGS and Operating Expenses forecast separates printing, domestic shipping, revenue-based charges and recurring overhead. Reviewing these cost controls alongside accepted orders helps assess how supplier pricing or marketing intensity changes operating margins.
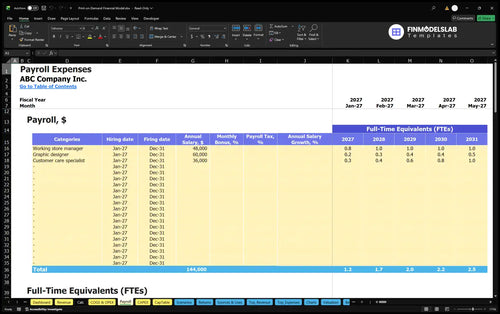
| Payroll role | 2026 FTE | 2030 FTE | Annual base/FTE |
|---|---|---|---|
| Working store manager | 0.75 | 1 | $48,000 |
| Graphic designer | 0.20 | 0.50 | $60,000 |
| Customer care specialist | 0.25 | 1 | $36,000 |
FTE represents annual-average staffing, not a count of full-time individuals.
The Payroll Forecast plans staff roles, annual base pay, FTE levels and monthly personnel expenses. In the illustrated case, the three roles total $57,000 in 2026 and $114,000 in 2030, separately from supplier and operating costs.
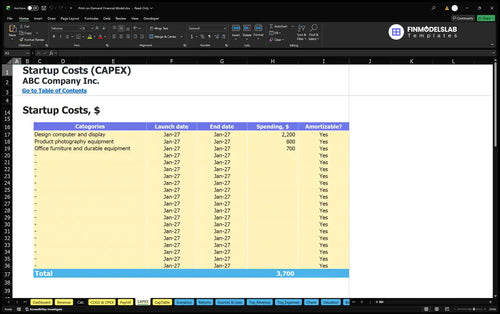
The startup plan separates durable equipment, one-time prelaunch spending, opening funding and working-capital assumptions from recurring operating expenses.
Startup durable assets comprise a $2,200 design computer and display, $800 of product photography equipment, and $700 of office furniture and equipment: $3,700 altogether. Separate opening cash items cover formation, storefront setup, product sample testing and the prelaunch audience campaign.
The Capital Expenditure Plan records durable equipment purchases and their timing, with depreciation schedules where applicable. These opening asset purchases are distinct from monthly store expenses and should not be mistaken for an EBITDA charge.
The initial owner-funding assumption is $70,267, covering estimated setup spending, zero opening trade working capital and a reserve equal to three months of first-year operating outflows. Customer checkout receipts precede supplier fulfillment billing; receivables, payables and inventory are each modeled at zero days.
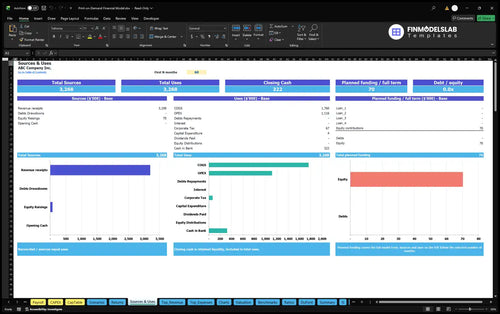
Sources and Uses of Funds summarizes how equity, any entered debt and operating cash sources are allocated to setup, investment and ongoing payments. The example assumes owner funding, not a committed loan or outside investor.
The Base-case operating projection shows demand-led revenue growth alongside direct costs, selling expenses, overhead and staff compensation, ending at EBITDA rather than net income.
| Year | Revenue | Operating expenses | EBITDA |
|---|---|---|---|
| 2026 | $231,336 | $244,269 | -$12,933 |
| 2027 | $385,560 | $379,779 | $5,781 |
| 2028 | $612,612 | $559,823 | $52,789 |
| 2029 | $837,522 | $730,756 | $106,766 |
| 2030 | $1,130,976 | $961,166 | $169,810 |
Estimated scenario outputs, not observed results or industry averages; rounded to whole dollars.
The 2026 example produces an operating EBITDA loss of $12,933 as costs exceed $231,336 of revenue. The modeled EBITDA turns positive in 2027 and reaches $169,810 in 2030, contingent on the stated traffic, conversion, spending and staffing assumptions.
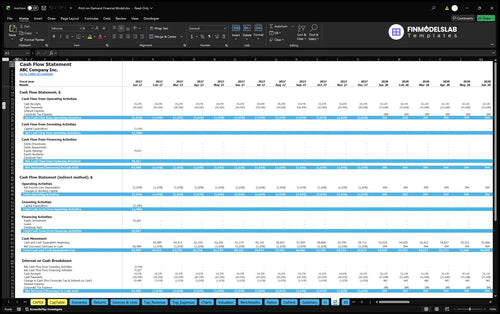
The Cash Flow Forecast tracks projected operating, investing and financing cash movements, including owner contributions and equipment purchases. It provides a separate view of liquidity because checkout receipts, supplier billing, startup spending and EBITDA answer different financial questions.
Low, Base and High scenario controls let users vary revenue, COGS, variable expenses, fixed costs and payroll assumptions. They are useful for seeing how a weaker conversion rate or higher fulfillment costs could alter the operating case; no alternative scenario outputs are presumed.
The Returns report provides separate tests for required sales, cash break-even timing, recovery of invested cash and annual return on invested capital.
The Break-Even, Payback and ROIC report compares revenue with operating break-even requirements, examines cumulative project cash flow and calculates invested-capital returns. Its different outputs help distinguish a store covering costs from an investor recovering funds.
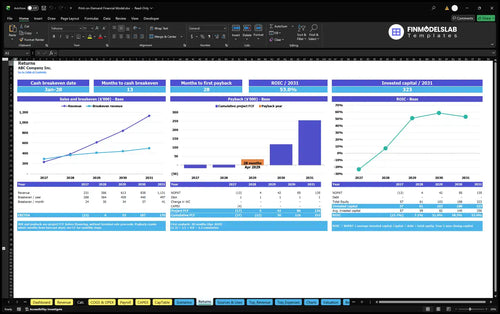
Sales break-even asks how much revenue is needed to cover the modeled cost structure. Cash break-even asks when cumulative cash flow changes sign, while investment payback measures recovery of committed funds and annual ROIC compares returns with invested capital.
The Valuation report also supports discounted-cash-flow and terminal-assumption sensitivity analysis. Neither an investment payback date, an IRR, a ROIC figure nor a business valuation is supplied by this example, so none should be inferred from EBITDA.
These answers clarify the illustrated assumptions and which planning questions the Excel workbook is designed to support.
Yes. Revenue and Calc use editable qualified sessions, accepted-order conversion, prices and category shares to recalculate the monthly sales forecast.
No. One accepted-order pool is divided across five product categories, with each illustrated order containing one item.
Yes. The example budgets supplier products and printing at 38.24% of revenue and outsourced domestic shipping at 16.81%.
No. Role-based salaries are modeled in Payroll and excluded from the direct, variable and fixed expense categories.
The estimated $70,267 owner contribution finances opening assets, other setup spending and a reserve; it is not operating revenue or profit.
U.S. Shopify stores selling original designs through outsourced domestic fulfillment, with five single-item product categories rather than wholesale, stocked inventory or owned manufacturing.
Yes. The Dashboard contains Low, Base and High scenario multipliers for revenue, COGS, variable expenses, fixed expenses and payroll.
No. EBITDA excludes separate cash, financing and investment effects; use Cash Flow and Returns to examine liquidity and payback.

KPIs, forecasts, and cash flow at a glance.
Key assumptions and calculations driving revenue forecasts.
Funding sources, spending, and closing cash.
Cash break-even, payback, and ROIC.
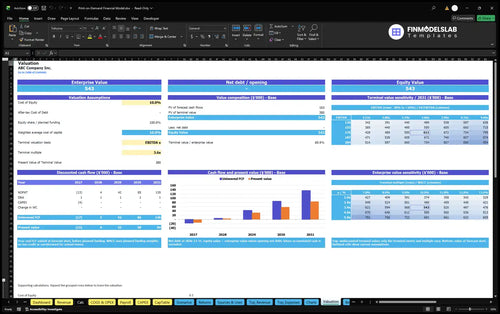
DCF valuation and sensitivity analysis.
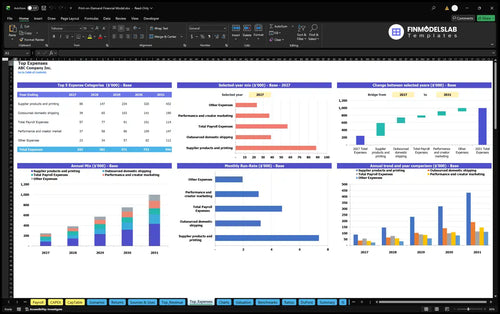
Largest costs and spending trends.
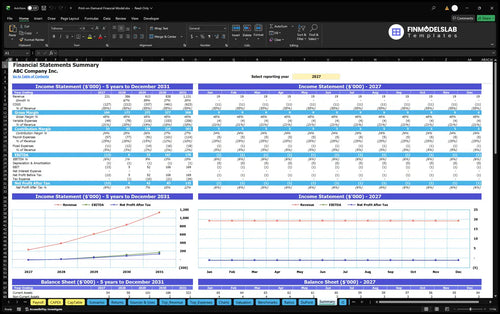
Annual and monthly financial performance.
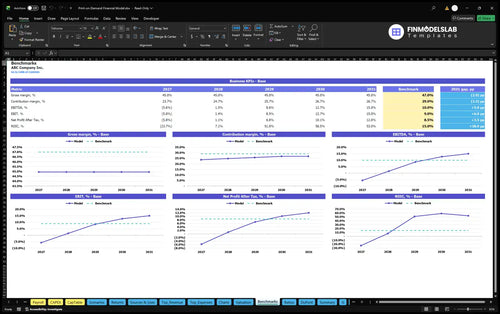
Compare margins and returns to benchmarks.

I was unsure what investors expected, but this template gave me a clean structure to follow. It helped me prepare a clearer model in a few hours and made our first investor conversation much easier to schedule.

I was worried one wrong formula could throw off the whole file, but the layout made it easier to trust the numbers. I caught issues fast and finished my forecast without rebuilding the spreadsheet from scratch.
I’m not deep into Excel, so the step-by-step layout was a relief. I was able to fill in the assumptions, build a usable projection, and move on without feeling stuck on the technical side.