

Revenue and Monthly Calc
Set seats, daily turns, utilization, service days, ticket prices, and category mix. Revenue shows annual projections; Calc applies launch timing and calculates monthly covers and sales.


This Excel Restaurant Financial Model forecasts 2026–2030 sales for a 64-seat casual restaurant using seats, daily turns, service days, utilization, and five realized guest-ticket prices.
The example covers a roughly 3,000-square-foot suburban U.S. location serving lunch and dinner six days weekly, without alcohol, delivery, or catering. Documented annual results stop at EBITDA, not net income or cash flow.
The workbook connects restaurant-specific operating assumptions to monthly calculations and financial reports, rather than relying on a single sales-growth percentage.
Set seats, daily turns, utilization, service days, ticket prices, and category mix. Revenue shows annual projections; Calc applies launch timing and calculates monthly covers and sales.
Separate ingredient, variable transaction and consumable costs from fixed overhead. Payroll handles role-level FTE, base salaries, and timing.
CAPEX plans restaurant purchases; CapTable records equity; Dashboard debt controls connect to Debt repayment schedules.
Income Statement, Cash Flow, and Balance Sheet produce financial reports. Dashboard and Summary organize results; Checks flag reconciliation issues.
Returns, Scenarios, Sources & Uses, Valuation, and Top_Expenses support break-even, funding, alternative assumptions, and cost analysis.
Monthly sales come from one shared pool of capacity-based served covers, allocated once among five complete guest tickets.
The model multiplies 64 usable seats by 2.5 planned seat turns per service day and 26 service days, then applies sold-cover utilization. Utilization rises from 45% in 2026 to 50%, 55%, 58%, and 60% in 2027–2030.
Tickets and cover shares are bowls and salads ($22; 15%), lunch sandwiches ($24; 15%), vegetarian dinners ($32; 15%), poultry and pork dinners ($36; 30%), and beef and seafood dinners ($44; 25%). Their weighted complete guest ticket is $33.50.
The Revenue Forecast shows seats, turns, service days, utilization, and guest-ticket mix. It feeds Calc, which allocates the same monthly cover pool across five meals without double-counting capacity.
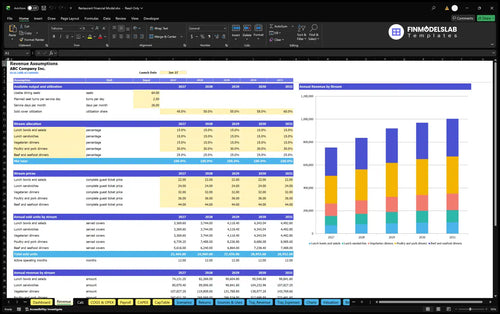
64 seats × 2.5 turns × 26 days × 45% utilization = 1,872 covers monthly; 1,872 covers × $33.50 ticket = $62,712 monthly revenue.
Twelve operating months produce $752,544 in 2026 revenue, starting in the January launch month. No independent demand forecast, delivery stream, or additional guest-volume pool is included.
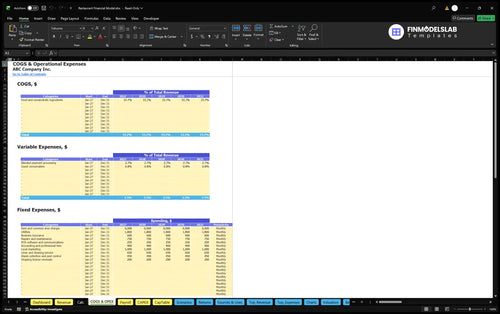
Separate direct, variable, fixed, and payroll schedules keep each cost in one category.
Food and nonalcoholic ingredients equal 33.7% of sales; payment processing is 2.7% and guest consumables 0.8%. Fixed costs include rent, utilities, insurance, repairs, POS, professional fees, marketing, cleaning, waste management, and renewals.
The COGS and Operating Expenses forecast separates percentage-based ingredients and guest-level costs from fixed monthly restaurant overhead. The example includes $6,000 per month in rent and common-area charges, within $145,200 of annual fixed expenses.
Payroll is not counted in other operating cost categories. The 2026 plan has eight annual-average FTE: one chef, two line cooks, three servers, one dishwasher, and one manager.
The Payroll Forecast tracks staff roles, annual-average FTE, base pay, and monthly staffing expense. In this restaurant case, projected payroll rises from $322,000 in 2026 to $372,500 in 2030 as kitchen, service, and dishwashing FTE increase.
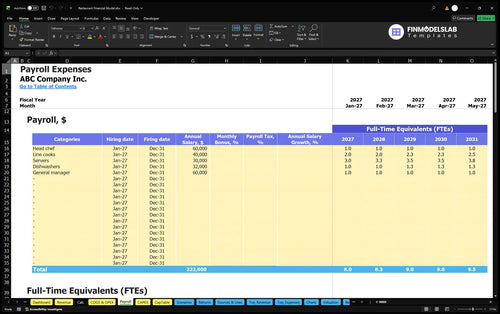
By 2030 staffing reaches 9.5 annual-average FTE: one chef, 2.5 line cooks, 3.75 servers, 1.25 dishwashers, and one manager. Employer payroll taxes, benefits, and personal taxes are excluded.
Opening assets, prelaunch cash, working capital, and funding are separate from operating expenses.
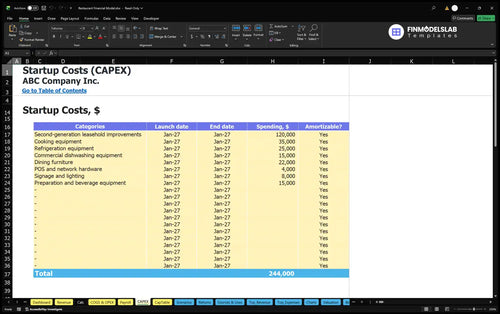
Startup assets include $120,000 in leasehold improvements, $35,000 in cooking equipment, $25,000 in refrigeration, and $15,000 in dishwashing equipment. Furniture, POS hardware, signage, and preparation equipment are separate assets.
The Capital Expenditure Plan organizes restaurant asset purchases, timing, and depreciation schedules. These opening investments are separate from the annual food, premises, and salary costs used to calculate operating EBITDA.
Separate prelaunch cash covers permits, lease deposit, marketing, training, rent, utilities, and nonfood supplies. Working-capital controls assume zero receivable days, five payable days, and ten inventory days.
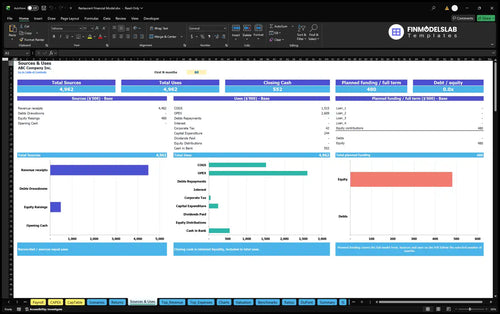
Sources and Uses of Funds summarizes funding sources and the cash allocated to operating, investing, and financing uses. The restaurant example estimates initial owner funding of $480,330, with no confirmed nonowner funding entered in its opening funding calculation.
The documented restaurant example increases revenue as sold-cover utilization rises, while separately accounting for operating costs and staffing.
| Year | Revenue | Operating Expenses | EBITDA |
|---|---|---|---|
| 2026 | $752,544 | $747,146 | $5,398 |
| 2027 | $836,160 | $785,752 | $50,408 |
| 2028 | $919,776 | $842,357 | $77,419 |
| 2029 | $969,946 | $861,020 | $108,926 |
| 2030 | $1,003,392 | $890,962 | $112,430 |
Illustrative projections, not historical results or industry averages. Amounts are rounded to whole dollars; displayed totals can differ slightly.
In 2026, the case produces approximately $5,398 of EBITDA on $752,544 in revenue after $747,146 of operating expenses. By 2030, it shows $112,430 of EBITDA on $1,003,392 in revenue, reflecting higher utilization alongside increased payroll.
EBITDA is not accounting net profit or cash generated. The supplied annual figures stop at EBITDA; the workbook’s Income Statement, Cash Flow, and Balance Sheet reports use additional depreciation, financing, tax, working-capital, and capital-spending schedules.
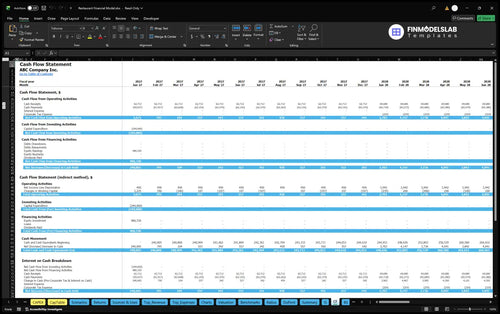
The Cash Flow Forecast separates operating cash movements from investing and financing activities and reconciles opening and closing cash. Use it to assess cash availability after initial restaurant purchases, working-capital timing, and any financing assumptions entered into the workbook.
The Returns and scenario reports support restaurant investment analysis, but the supplied EBITDA figures do not prove a payback date or investor return.
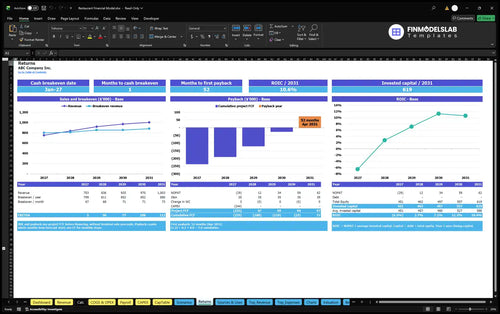
Sales break-even compares sales with operating cost coverage. Cash break-even tests cash timing; payback uses cumulative project cash flows; annual ROIC relates returns to invested capital. None is interchangeable with EBITDA.
Dashboard Scenario Controls apply Low, Base, and High multipliers to revenue, COGS, variable and fixed expenses, and payroll. Compare the resulting operating margins without treating untested scenarios as observed outcomes.
The Returns report presents break-even, investment payback, and return on invested capital analysis. Its calculations can help evaluate whether projected restaurant operations cover costs and recover invested funds, without implying any specific payback period or ROIC for this illustrative case.
The template fits owners, operators, and advisors evaluating a single-location casual restaurant with capacity-driven lunch and dinner sales.
Edit seats, turns, utilization, ticket prices, mix, costs, FTE, startup capital, and financing assumptions. The 2026–2030 example uses estimates rather than guaranteed performance.
Alcohol, third-party delivery, catering, and multiple locations fall outside this case. They require additional revenue and cost assumptions or customization.
Answers to common questions about editing this capacity-based restaurant financial model and interpreting its reports.
Yes. Adjust usable seats, daily table turns, monthly service days, and utilization in Revenue to update the capacity-based cover and sales forecast.
No. Five meal categories share one calculated pool of sold covers, allocated according to their percentage mix and realized ticket prices.
No. The documented operation covers on-premises lunch and dinner food sales and excludes alcohol, third-party delivery platforms, and catering.
No. The selected restaurant illustration excludes employer payroll taxes and benefits, so they should be evaluated separately if needed.
No. EBITDA precedes depreciation, interest, and income taxes, and it does not represent cash flow or investor distributions.
Yes. Dashboard Scenario Controls compare Low, Base, and High multipliers for revenue, direct costs, variable expenses, fixed expenses, and payroll.
No. The Returns worksheet supports investment payback and ROIC calculations, but the provided restaurant example does not establish a tested payback date or return.
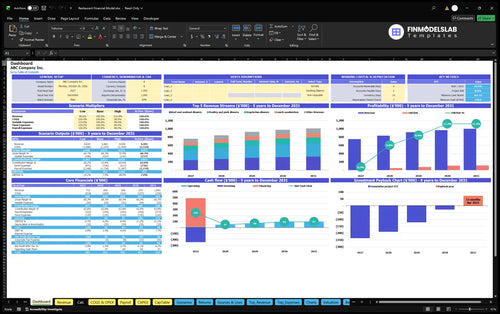
KPIs, forecasts, and cash flow at a glance.
Key assumptions and calculations driving revenue forecasts.
Funding sources, spending, and closing cash.
Cash break-even, payback, and ROIC.
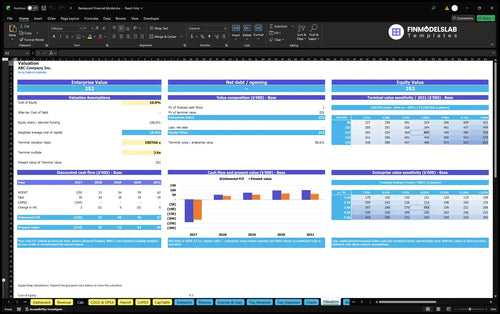
DCF valuation and sensitivity analysis.
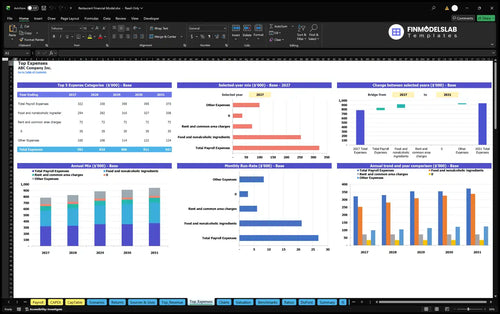
Largest costs and spending trends.
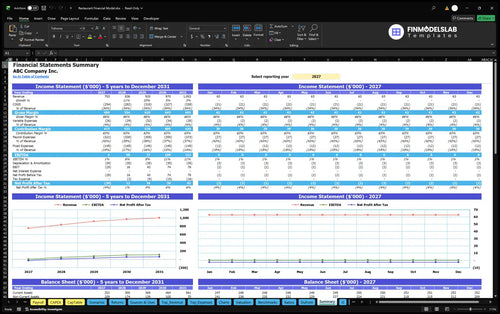
Annual and monthly financial performance.
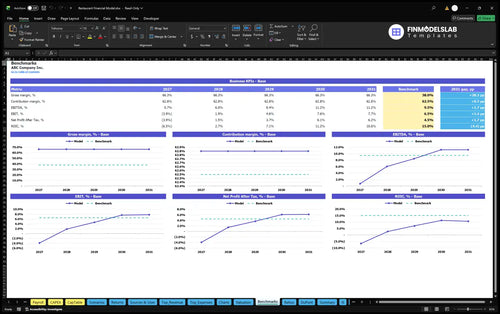
Compare margins and returns to benchmarks.

The low, base, and high cases were all laid out clearly, so I stopped wrestling with separate spreadsheets. It helped me compare scenarios in under an hour and walk into planning with cleaner answers.

I was spending too much time building restaurant financials by hand, and this template cut that down fast. What used to take a full day now takes me about two hours.
Pricing, costs, and growth were all scattered before, but this model brought everything into one place. That made the assumptions easier to review and saved me from rebuilding the sheet twice.