

Revenue & Calc
Edit daily orders, five-category mix, prices, seasonality, and launch timing; Calc builds monthly category revenue.


The Sandwich Shop Financial Model is an Excel template projecting daily orders, monthly revenue, expenses, staffing, and EBITDA for a U.S. counter-service sandwich shop from 2026 to 2030.
The example is a 1,000-square-foot leased shop trading 10 hours daily, six days weekly. It serves walk-in and pickup customers, not franchise or marketplace orders; all figures are editable estimates.
The workbook links sandwich-order assumptions with monthly calculations, statements, financing, and management analysis.
Edit daily orders, five-category mix, prices, seasonality, and launch timing; Calc builds monthly category revenue.
Plan ingredients, packaging, card fees, promotions, overhead, and staff FTE while keeping salaries in Payroll.
Record equipment investments, equity, and optional debt; review funding and liquidity across the statements.
Review Income Statement results, scenarios, break-even, investment returns, valuation sensitivity, and checks.
One pool of paid meals is allocated once among five menu categories.
The example models 120 paid meals daily in 2026, rising to 180 in 2030. It uses 26 trading days monthly and repeating seasonal multipliers; the menu shares total 100%.
Mix: 30% cold deli, 25% hot, 15% vegetarian, 20% premium, and 10% boxed lunches. Respective 2026 prices are $11, $12.50, $10.50, $14, and $15.
The Revenue Forecast applies meal demand, trading days, seasonal adjustments, menu mix, and annual prices to calculate category sales. Calc produces the monthly totals feeding financial statements.
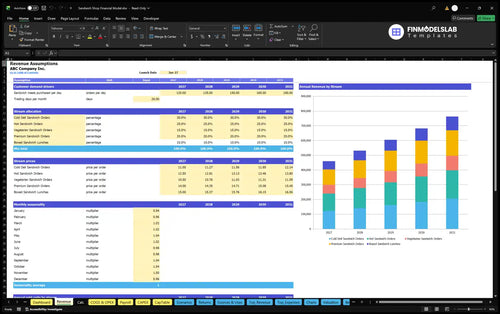
30% × $11 + 25% × $12.50 + 15% × $10.50 + 20% × $14 + 10% × $15 = $12.30 per meal; 120 daily meals × 26 days × 12 average-seasonality months × $12.30 = $460,512.
Seasonal multipliers sum to 12 across the year; the average factor is one, reconciling the 2026 annual revenue example.
Although the specified launch date is January 31, 2026, the forecast treats January as a full operating month.
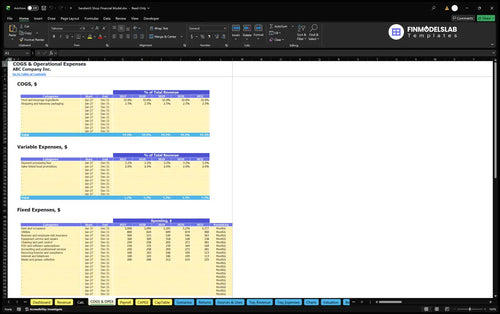
Food costs, variable fees, overhead, and base payroll occupy separate schedules.
Ingredients use 32% of revenue, packaging 2.5%, card fees 3.2%, and sales-linked promotion 2%. Direct COGS therefore equal 34.5% of sales and other variable expenses 5.2%.
Fixed expenses include rent, utilities, insurance, maintenance, software, professional fees, compliance, and waste collection. Monthly rent begins at $3,000 in 2026.
The COGS and Operating Expenses forecast separates direct ingredients and packaging, variable selling fees, and fixed shop overhead. Change cost rates and paid months to test margins without double-counting payroll.
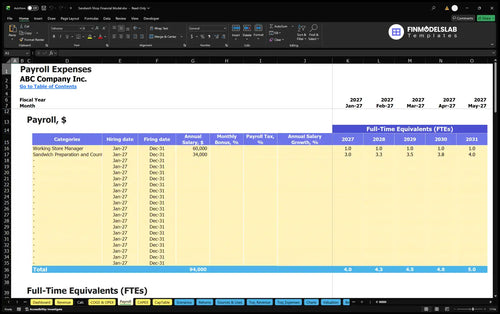
The manager is one FTE at $60,000 annual base pay; counter and preparation crew grow from three FTEs in 2026 to four in 2030 at $34,000 each.
Base payroll totals $162,000 in 2026 and $196,000 in 2030. The example excludes employer taxes, benefits, and personal taxes.
The Payroll Forecast allocates role-level FTE, salaries, and hiring dates into monthly personnel costs. Test whether increased counter staffing is affordable under planned sandwich sales.
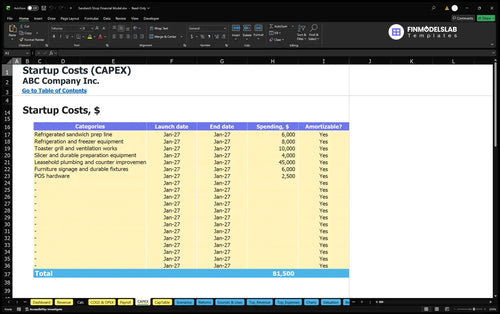
Opening investments and funding are separate from operating earnings.
Four specified equipment costs total $28,000: a $6,000 prep line, $8,000 refrigeration, $10,000 grill and ventilation, and $4,000 preparation tools. Other opening assets cover leasehold improvements, fixtures, and POS hardware.
The Capital Expenditure Plan schedules equipment purchases and depreciation apart from operating expenses. Enter site-specific supplier quotes and purchase dates to refine the required initial investment.
Permits, deposits, launch marketing, training, and setup are separate cash uses. Working-capital inputs assume zero receivable days, four payable days, and six inventory days.
Estimated owner funding is $210,744, covering modeled opening needs and a three-month operating reserve after non-owner funding. It does not establish cash sufficiency.
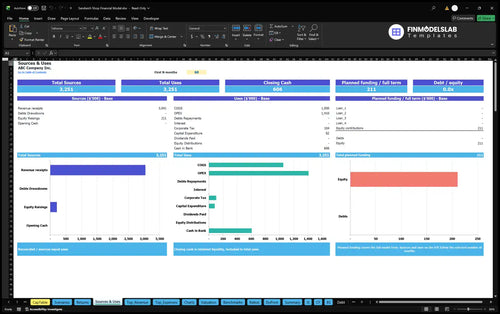
The Sources and Uses of Funds report reconciles equity, optional debt, receipts, investments, and other payments. It separates funding needs and retained cash from operating profit.
The illustrated Base case combines rising order demand and prices with operating expense and payroll projections.
| Year | Revenue | Operating Expenses | EBITDA |
|---|---|---|---|
| 2026 | $460,512 | $412,623 | $47,889 |
| 2027 | $530,902 | $451,102 | $79,800 |
| 2028 | $604,796 | $491,033 | $113,763 |
| 2029 | $681,981 | $532,333 | $149,648 |
| 2030 | $762,456 | $575,005 | $187,452 |
Illustrative planning projections, not historical performance or an industry average. Whole-dollar rounding may create small displayed differences.
Illustrative EBITDA rises from $47,889 on $460,512 sales in 2026 to $187,452 on $762,456 sales in 2030. The corresponding EBITDA margins are approximately 10.4% and 24.6%.
The Income Statement includes below-EBITDA items when configured, but the stated case establishes neither net profit nor cash remaining after investing and financing.
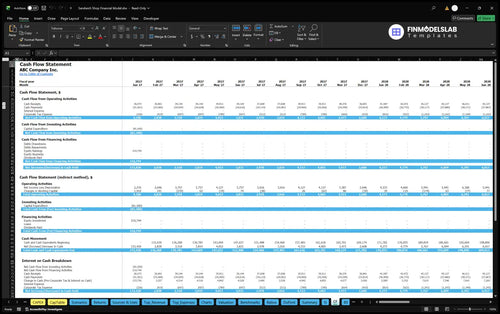
The Cash Flow Forecast reconciles operating, investing, and financing cash flows monthly. Use it to examine inventory purchases, equipment spending, equity contributions, and borrowing needs.
The reports support investment analysis, but the example supplies no payback date, ROIC, or valuation result.
Sales break-even covers operating costs; cash break-even considers cash timing; payback tracks cash invested versus cash recovered; annual ROIC measures returns against invested capital. EBITDA alone establishes none of these.
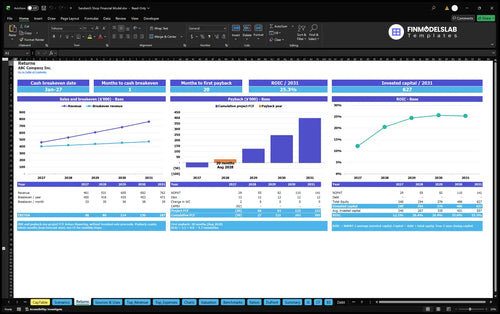
The Returns report analyzes sales and cash break-even, free cash flow, investment payback, and annual ROIC. Enter the actual startup and financing plan to evaluate recovery of invested funds.
Dashboard Scenario Controls set Low, Base, and High revenue, COGS, variable expense, fixed expense, and payroll multipliers. Test traffic shortfalls or food-cost and wage changes.
Debt Controls cover up to four financing facilities; Valuation offers DCF sensitivity once relevant assumptions are entered. No financing terms are specified for this case.
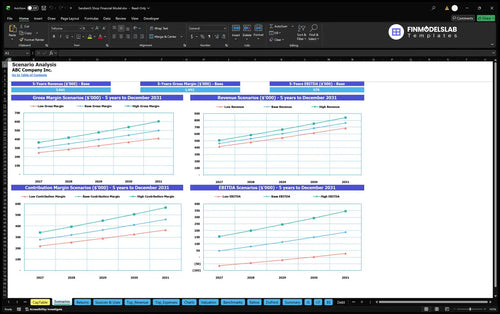
The Financial Scenario Analysis compares Low, Base, and High sales, gross margin, contribution margin, and EBITDA. Examine sensitivity to demand, ingredient prices, and payroll before committing.
This template fits an independent counter-service sandwich shop with direct pickup.
Compare menu pricing, meal traffic, staffing, and rents; use actual quotes before presenting forecasts. The model excludes franchise royalties and delivery marketplaces.
Answers about the editable sandwich-shop forecast and its limits.
Yes. Update five-category prices and shares; the model recalculates revenue from one order pool.
No. It covers walk-in and direct pickup transactions without third-party delivery or franchise operations.
Daily orders are multiplied by 26 trading days and monthly seasonality, then allocated to menu categories.
No. Store manager and crew salaries sit in Payroll, separate from ingredients, packaging, fees, and overhead.
No. It is an estimated owner contribution. Recheck investment and operating inputs against Cash Flow and funding reports.
No. EBITDA excludes depreciation, interest, taxes, and cash-flow items; it is not owner income.
Yes. Debt Controls support financing schedules, and Returns models break-even, payback, and ROIC; this case specifies no repayment terms or payback date.
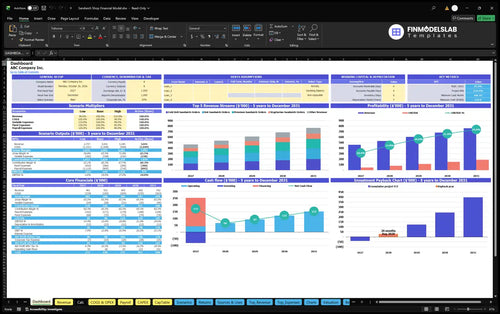
KPIs, forecasts, and cash flow at a glance.
Key assumptions and calculations driving revenue forecasts.
Funding sources, spending, and closing cash.
Cash break-even, payback, and ROIC.
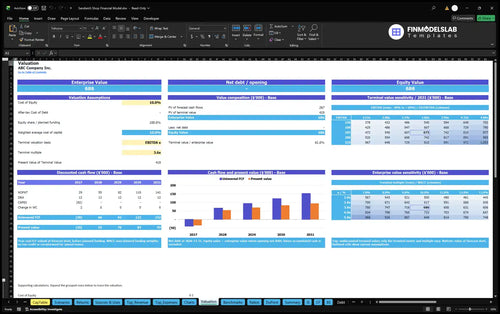
DCF valuation and sensitivity analysis.
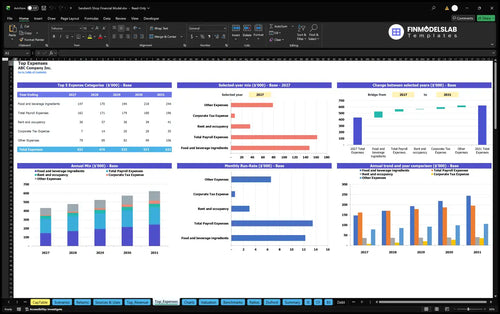
Largest costs and spending trends.
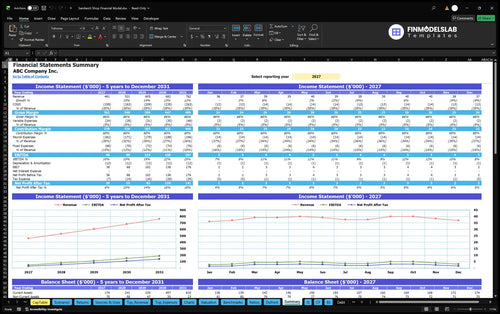
Annual and monthly financial performance.
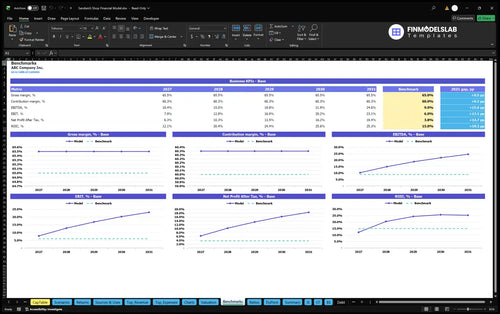
Compare margins and returns to benchmarks.

This template showed me exactly what investors expect, so I stopped guessing about the right format. It saved me hours of rework and made our first meeting much easier to prepare for.

Running low, base, and high cases by hand was a mess before this model. Now I can compare all three in one place and save a few hours every time I update assumptions.
Building the full sandwich shop forecast myself would have taken days, and probably longer. This template cut that down to a single working session and gave me a cleaner model to share.