

Visitor Traffic
Weekday visitor assumptions, adjusted by monthly seasonality, create the store's visitor base.


It is a fully editable five-year Excel workbook linking store traffic, conversion, repeat purchasing, product mix, costs, scenarios, and financial statements.
Use it to build a store-specific forecast from operating assumptions and see how sales, costs, cash flow, profitability, and funding needs develop over time.
Inputs feed monthly calculations and annual summaries, so changes to visitors, conversion, repeat behavior, product mix, pricing, seasonality, costs, staffing, and capital spending flow into reports.
It converts store visitors into buyers, carries repeat-customer cohorts forward, turns orders into units, allocates units by category mix, and applies category prices.
Weekday visitor assumptions, adjusted by monthly seasonality, create the store's visitor base.
New buyers equal store visitors multiplied by the visitor-to-buyer conversion rate.
A share of new buyers repeats for its lifetime at the stated monthly order rate.
First orders plus active repeat orders form total orders, then units follow from units per order.
Units are allocated by sales mix, priced by category, and summed into total retail revenue.
The Revenue view organizes visitor traffic, conversion, repeat-customer behavior, order size, category mix, prices, launch timing, and seasonality behind the sales forecast.
 REVENUE
The COGS & OPEX view separates direct inventory costs, variable expenses, and fixed operating expenses with timing and period assumptions feeding the forecast.
 COGS & OPEX
The Scenarios view places Low, Base, and High cases side by side across revenue, gross margin, contribution margin, and EBITDA over the forecast.
 SCENARIOS
The Dashboard combines global setup, scenario selection, working-capital controls, core financials, revenue mix, profitability, cash flow, and investment payback in one view.
 DASHBOARD
It fits stores using visitor-conversion, repeat-customer, order, unit, mix, and category-pricing logic; materially different operating mechanics may call for custom structure.
The template is a planning starting point, not a guarantee of performance.
Financial Models Lab can build or adapt a model when you need different revenue logic, operating schedules, or reporting from the ready-made structure.
ORDER A CUSTOM FINANCIAL MODELAfter checkout, you receive an instantly downloadable, fully editable Excel model with a five-year forecast, scenario analysis, and financial reports.
Receive the fully editable Excel financial model after checkout.
Plan across five years with monthly calculations and annual reporting views.
Compare Low, Base, and High cases through the model's scenario view.
Review Income Statement, Cash Flow, Balance Sheet, Dashboard, and supporting analysis views.
The essential answers are visible in full, with no accordion clicks required.
Revenue begins with store visitors and conversion to new buyers, adds active repeat-customer orders, converts orders to units, allocates units by sales mix, and prices each category.
You can edit launch date, weekday visitors, conversion, repeat-customer share and lifetime, repeat order frequency, units per order, sales mix, category prices, and monthly seasonality.
You can compare alternative cases across revenue, gross margin, contribution margin, and EBITDA over the five-year forecast.
The product shows Income Statement, Cash Flow, Balance Sheet, Dashboard, Summary, break-even, ROIC, valuation, charts, KPIs, ratios, and other supporting reports.
Yes. Financial Models Lab offers custom financial modeling when you need different revenue logic, operating schedules, or reporting.
It is a planning forecast based on editable assumptions, not a guarantee of business performance or financial results.
This pre-written financial template for a plumbing supply business includes a 5-year forecast, dynamic dashboard, detailed cost breakdowns, and complete financial statements.
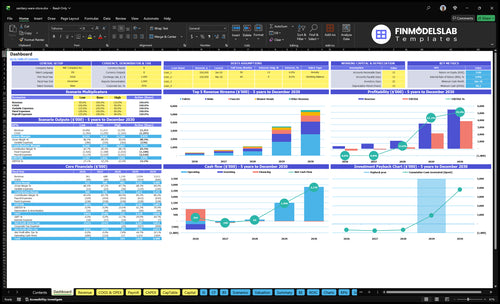
Core inputs and core outputs
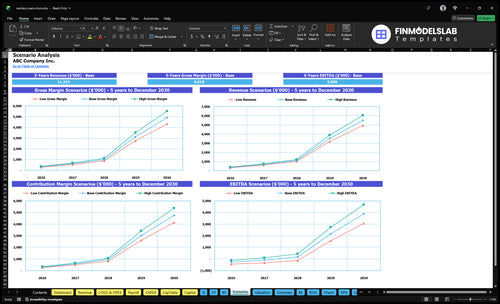
Three scenario analysis
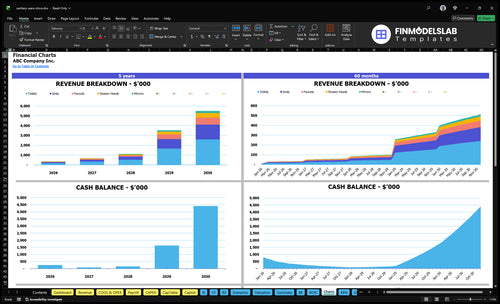
Presentation ready

DuPont analysis
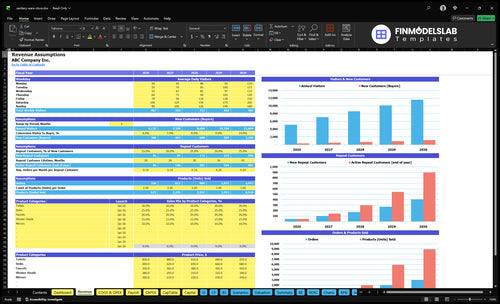
Researched revenue assumptions
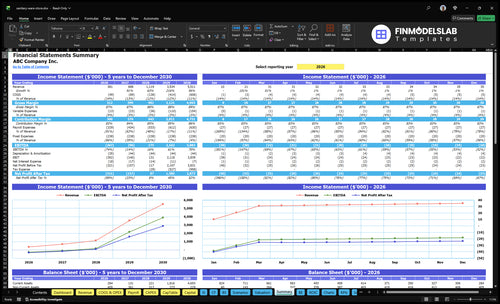
Lender-friendly financial outputs

Revenue stream detailed view
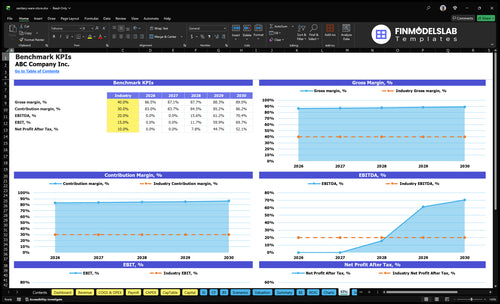
Performance metrics benchmark

This template made low, base, and high cases easy to compare without rebuilding the model each time. I saved a full afternoon and could show three outcomes in one meeting.

I’m not deep into Excel, so having the formulas and tabs already set up made a big difference. I built the forecast in under an hour instead of getting stuck on advanced modeling.
I didn’t know which outputs investors would expect, but the structure here pointed me to the right numbers right away. It helped me walk into a funding call with a cleaner story and a better-prepared model.