

Revenue and Calc
Set guard hours, utilization, prices, and service mix. Calc applies launch timing and consolidates revenue without counting hours twice.


The Security Company Financial Model is an Excel template for a Jacksonville, Florida unarmed guarding agency. Guard-hour capacity, utilization, service mix, and hourly prices drive monthly revenue, expenses, and EBITDA projections for 2026–2030.
Five services are modeled: commercial, residential, construction, event security, and fire watch. The assumptions are estimates, not historical results or industry averages.
The workbook connects operating assumptions to monthly projections, financial statements, funding, and management reports.
Set guard hours, utilization, prices, and service mix. Calc applies launch timing and consolidates revenue without counting hours twice.
Plan field costs, overhead, officer FTE, and operations staffing. Monthly schedules connect expenses with forecast results.
Plan equipment investment and equity contributions. Dashboard debt controls and Debt handle optional financing and repayments.
Income Statement, Cash Flow, and Balance Sheet present results, cash movements, and financial position; Summary and Checks support review.
Dashboard, Scenarios, Returns, Valuation, Ratios, and Sources & Uses help compare cases, financing, break-even, and returns.
Revenue applies billable utilization and five hourly prices to one shared guard-hour pool.
In 2026, 1,280 available guard hours per month at 80% utilization produce 1,024 sold guard hours monthly. The 35% commercial, 25% residential, 20% construction, 10% event, and 10% fire-watch shares divide that same total; they are not five separate capacity pools.
By 2030, monthly available hours reach 2,560 and utilization 90%, with higher service prices. No separate demand ceiling is imposed; bookings must be independently assessed.
The Revenue Forecast shows capacity, utilization, hourly prices, and sold-hour allocation. Its inputs feed Calc and monthly revenue, enabling comparisons of guard scheduling and billing choices.
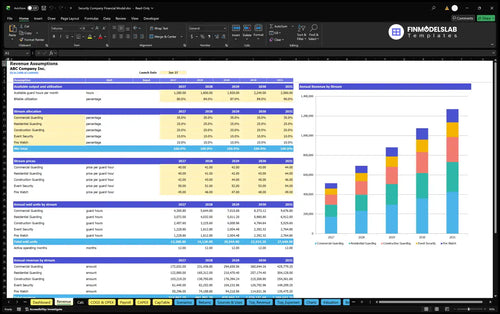
| Service | Sold-hour share | Price / guard hour |
|---|---|---|
| Commercial guarding | 35% | $40 |
| Residential guarding | 25% | $40 |
| Construction guarding | 20% | $42 |
| Event security | 10% | $50 |
| Fire watch | 10% | $45 |
Shares total 100% of one sold-hour pool; the 2026 weighted-average realized price is $41.90 per guard hour.
1,024 sold guard hours/month × 12 months × $41.90 per hour ≈ $514,867 annual revenue.
The forecast separates revenue-related costs, fixed overhead, and staffing without double counting.
Direct COGS comprise travel and reimbursements at 2% of revenue and uniforms/training at 1.5%. Variable expenses include acquisition at 2%, processing at 0.3%, and credit losses at 0.5% of revenue.
The COGS and Operating Expenses forecast separates field costs, selling expenses, and overhead. Editable rates, dates, and frequencies show how spending affects margins.
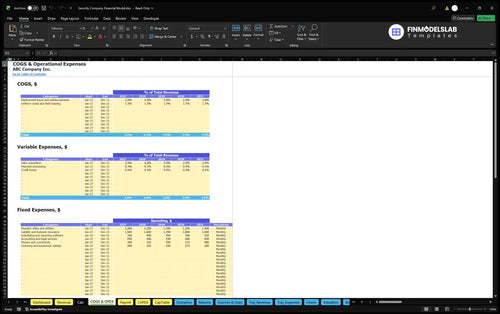
Fixed overhead covers dispatch, insurance, software, professional services, phones, licensing, and upkeep. Dispatch office and utilities rise from $1,200 monthly in 2026 to $1,400 in 2030; payroll is separate.
The 2026 example has $18,020 COGS, $14,416 variable expenses, $48,000 fixed costs, and $392,800 separate payroll for officers and operations staff.
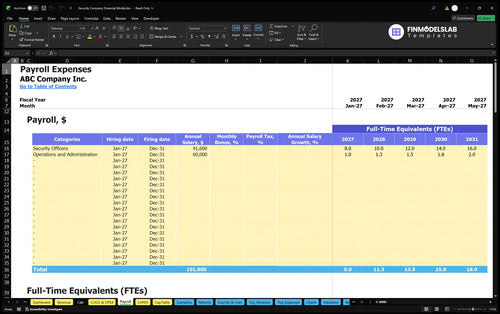
The Payroll Forecast tracks officer and administration FTE and salaries. Officers grow from 8 to 16 FTE at $41,600 annual base per FTE; administration rises from 1 to 2 FTE at $60,000.
Startup assets and owner funding are separate from expenses used in operating EBITDA.
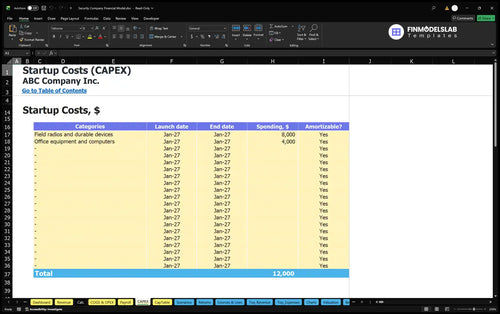
Startup assets include $8,000 in radios and devices plus $4,000 in office equipment. Separate prelaunch cash items cover licensing, website, legal work, deposits, and prepayments.
The Capital Expenditure Plan schedules equipment purchases, budgets, and applicable depreciation. Its asset calculations remain separate from recurring guarding expenses.
Working capital assumes 27 receivable days, zero payable days, and zero inventory days. Customer billings and cash receipts therefore need separate review.
Estimated initial owner funding is $181,652, based on assets, preopening cash, opening receivables, and three months of first-year outflows, less zero confirmed external funding. It is financing, not income or proof of cash sufficiency.
The Sources and Uses of Funds report compares equity, optional debt, receipts, operating payments, and investment over selected periods. It helps distinguish owner contributions from business earnings.
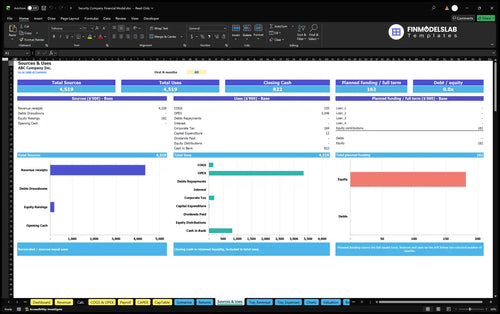
The 2026–2030 example projects higher revenue and EBITDA as guard capacity, utilization, and hourly prices rise.
| Year | Revenue | Operating Expenses | EBITDA |
|---|---|---|---|
| 2026 | $514,867 | $473,237 | $41,631 |
| 2027 | $691,891 | $586,189 | $105,702 |
| 2028 | $879,967 | $699,838 | $180,129 |
| 2029 | $1,074,152 | $813,872 | $260,280 |
| 2030 | $1,269,043 | $927,950 | $341,093 |
Illustrative forecast only. Dollar amounts are rounded to whole USD; displayed totals may differ slightly due to rounding.
The example moves from $514,867 revenue and $41,631 EBITDA in 2026 to $1,269,043 revenue and $341,093 EBITDA in 2030. These are modeled outcomes, not observed Jacksonville operating results.
Expenses include COGS, variable costs, fixed overhead, and payroll. EBITDA precedes depreciation, interest, and taxes; it is neither net profit nor closing cash.
The Cash Flow Forecast reconciles operating, investing, and financing cash movements. Use it to examine collections, capital spending, and funding because positive EBITDA does not establish liquidity.
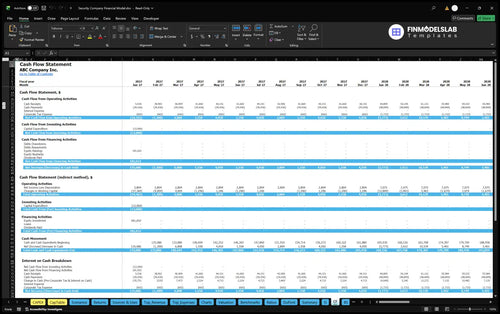
The workbook supports separate break-even, payback, return, valuation, and scenario analyses.
The Returns analysis distinguishes sales break-even, cash break-even timing, investment payback, and annual ROIC. Each uses its own costs, cash flows, or invested-capital figures rather than EBITDA alone.
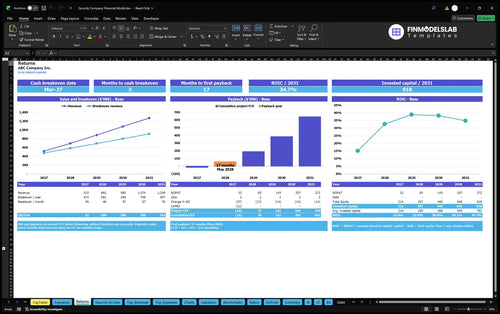
Dashboard Scenario Controls vary revenue, COGS, variable expenses, fixed costs, and payroll across Low, Base, and High. Scenarios compares gross margin, contribution margin, and EBITDA.
Dashboard has four optional debt facilities with amounts, dates, terms, interest, and repayment types. Debt and Cash Flow report their effects; no external financing, payback date, or valuation result is established.
Plan unarmed contract guard hours, hourly billing, staffing, and growth.
Operators and advisers can adjust rates, mix, utilization, staffing, and funding before reviewing forecasts. Test whether expanding the guard team is justified by billable hours.
Armed services, alarm installation, resale, remote monitoring, and patrol-fleet revenue are excluded. Those businesses need additional revenue and cost modeling.
These answers clarify the calculation method, editable assumptions, included reporting, and the limits of the example projections.
It covers unarmed commercial, residential, construction, event, and fire-watch guarding in Jacksonville, excluding armed services.
Available hours times utilization yield sold hours; those hours are allocated across five services and multiplied by their prices.
Yes. Edit capacity, utilization, hourly prices, and sold-hour mix; Calc converts these inputs into monthly revenue.
Yes. Payroll covers officer and administration staffing; COGS & OPEX covers field costs, variable expenses, and overhead.
No. EBITDA excludes depreciation, interest, and taxes and differs from net profit and cash on hand.
Yes. Dashboard includes three scenarios and four optional debt facilities, with corresponding calculations and comparisons.
Returns supports break-even, payback, and ROIC, but no case-specific payback timing or ROIC result is supplied.
No. These are estimates to revise for your own contracts, salaries, costs, and funding.
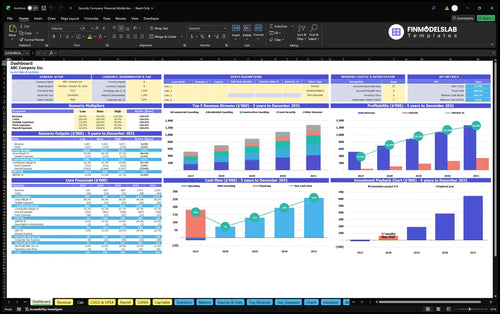
KPIs, forecasts, and cash flow at a glance.
Key assumptions and calculations driving revenue forecasts.
Funding sources, spending, and closing cash.
Cash break-even, payback, and ROIC.
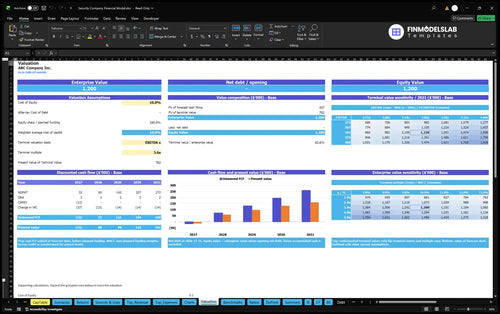
DCF valuation and sensitivity analysis.
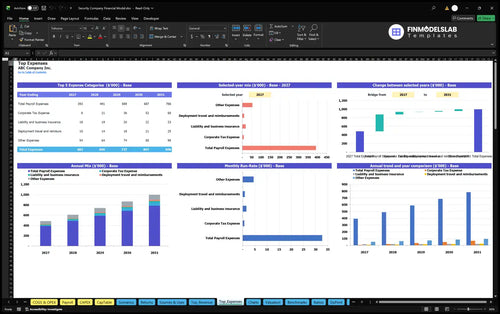
Largest costs and spending trends.
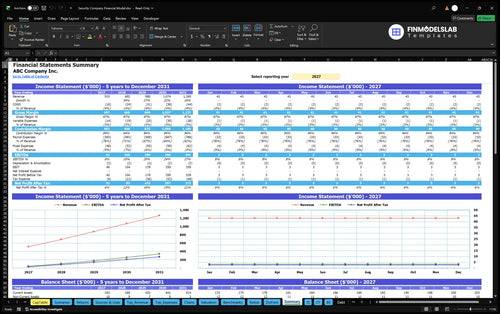
Annual and monthly financial performance.
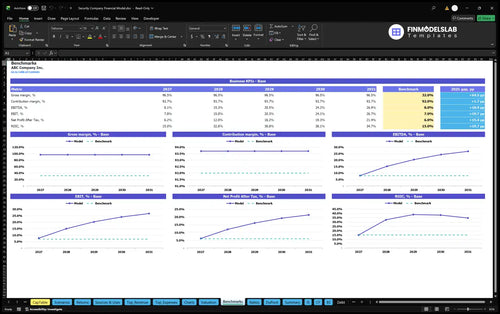
Compare margins and returns to benchmarks.

The low, base, and high cases were all set out cleanly, so I stopped wasting time comparing versions by hand. I had clearer assumptions in one place and could talk through the three scenarios with my team in minutes.

Building the model from scratch would have taken me days, but this template handled the core financials fast. I saved about 12 hours on the first draft and got to a review call with my partner the same afternoon.
Instead of digging through scattered files, I had the statements and charts in one place. That made my monthly review much easier and helped me send a clean update to leadership without piecing everything together.