

Revenue and Calc
Revenue and Calc translate table slots, utilization and mutually exclusive packages into monthly sales. The launch date suppresses earlier activity and includes the full launch month.


The Shisha Lounge Financial Model is an Excel template for planning a table-session business. Editable capacity, utilization, five package prices and staffing feed monthly projections for 2026 through 2030.
The illustrative case is a 21+ alcohol-free Houston lounge with 16 four-seat tables, 26 operating days monthly and eight evening hours. These projections are not trading results; site permits, ventilation and tobacco payment processing require separate approval.
The workbook connects the session-level operating model to monthly calculations, investment schedules, financial statements and decision reports.
Revenue and Calc translate table slots, utilization and mutually exclusive packages into monthly sales. The launch date suppresses earlier activity and includes the full launch month.
COGS & OPEX calculates sales-linked costs and monthly fixed budgets. Payroll separately models annual-average FTE and salaries so wages are not counted twice.
CAPEX, CapTable, Debt and Dashboard controls handle investment and funding assumptions. Income Statement, Cash Flow and Balance Sheet schedules connect operations to profits, liquidity and financial position.
Scenarios, Returns, Sources & Uses, Valuation, Charts, Ratios and Checks support sensitivity testing and reconciliation. The supplied case reports operating results through EBITDA only.
Revenue starts with a finite inventory of two-hour table slots, not a separate customer forecast, so package sales share the same capacity pool.
The lounge offers 16 tables × four slots daily × 26 days, or 1,664 available monthly sessions. Apply utilization, then allocate sold sessions across Classic, Premium, Fruit Head, Tea Bundle and Celebration.
The first four package shares total 90%; Celebration receives the residual 10%. Every package occupies one table slot, including the two-hookah Celebration bundle. Bundled drinks and snacks create no extra counted sales volume.
The Revenue Forecast displays editable utilization, annual package prices and the session mix that drive revenue. It summarizes packages by year while Calc allocates sessions and sales by month from the January 31, 2026 launch date.
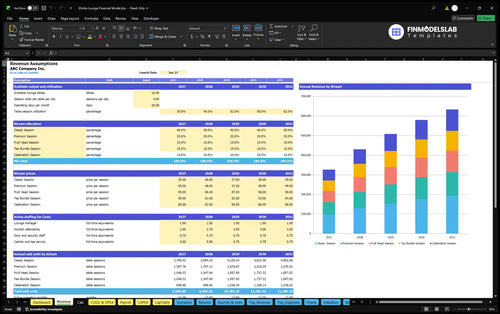
16 tables × 4 two-hour slots per day × 26 operating days per month = 1,664 available sessions per month.
In 2026, 35% utilization and a $46.75 mix-weighted price yield approximately $326,726 of revenue. Utilization rises to 62% by 2030, alongside entered annual package price increases.
The forecast applies sales-linked costs, fixed venue spending and separate role-based payroll to calculate operating expenses and EBITDA.
COGS equal 21% of revenue: tobacco/excise 10%, charcoal 3.5%, disposables 2.5%, and bundled refreshments 5%. Another 8.4% covers merchant card processing, sales-linked promotion and breakage.
The COGS and Operating Expenses report shows how direct and variable rates change with sales while fixed items follow monthly budgets. Rent, ventilation utilities, insurance, HVAC maintenance, cleaning, software, permits and entertainment sit outside the separately calculated payroll.
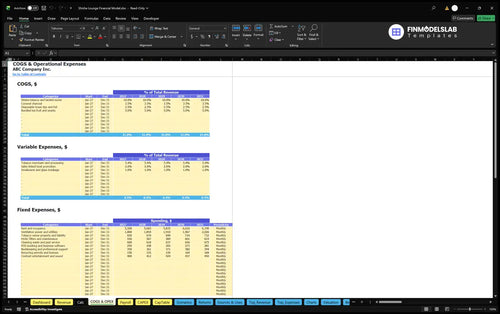
Fixed costs rise from $123,000 in 2026 to $138,438 in 2030 at roughly 3% annually. Rent begins at $5,500 monthly regardless of sessions sold.
The Payroll Forecast models a lounge manager, hookah attendants, door/security staff and cashier/tea service using annual-average FTE and fixed annual base pay. Hookah attendant staffing increases from 2.5 to 3 FTE as the operation develops, without counting wages again in COGS.
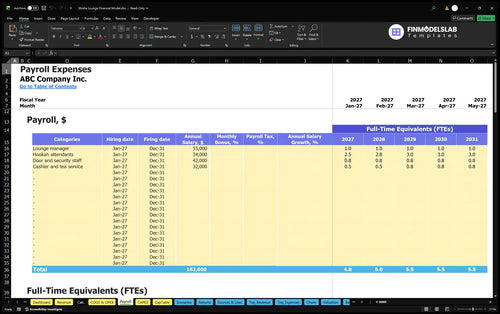
Base payroll rises from $187,500 in 2026 to $212,500 in 2030. Employer taxes, benefits and personal taxes are excluded from these documented operating assumptions.
Startup assets, opening cash items, inventory investment and owner contributions are modeled apart from annual operating earnings.
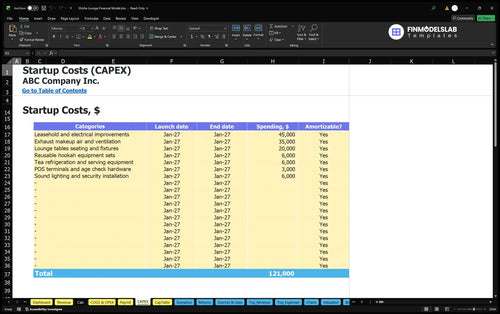
Startup assets total $121,000 for improvements, ventilation, furnishings, hookah sets and service/security equipment. Another $29,000 covers opening cash items including permits, deposits, marketing, preopening wages and occupancy.
The Capital Expenditure Plan records purchase dates for improvements, ventilation and equipment and tracks which items are depreciable. This distinguishes investment cash outflows from later depreciation charges, which are not deducted in the documented EBITDA figures.
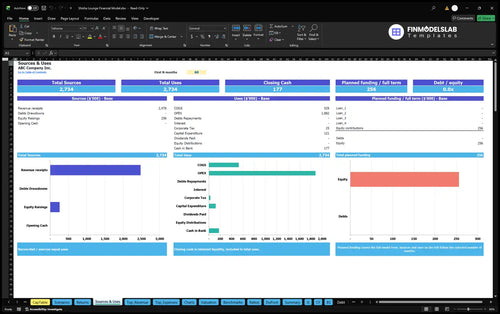
Estimated owner funding of $255,967 covers opening assets, other startup cash, inventory and three months of first-year cash operating costs. It is equity, not revenue or proof of cash sufficiency.
The Sources and Uses of Funds report organizes planned funding and its allocation across operating, investing and financing requirements. Together with the CapTable, it helps reconcile owner contributions with project cash needs rather than recording equity injections as operating income.
Receivable and payable days are zero; inventory days are 23. External debt and processor reserves are excluded, although Dashboard debt controls support alternative funding assumptions.
In the selected illustration, EBITDA is negative in the first two years and turns positive in 2028 as session revenue increases.
| Year | Revenue | Operating Expenses | EBITDA |
|---|---|---|---|
| 2026 | $326,726 | $406,558 | -$79,831 |
| 2027 | $429,961 | $449,099 | -$19,138 |
| 2028 | $508,265 | $492,421 | $15,845 |
| 2029 | $579,651 | $517,323 | $62,328 |
| 2030 | $633,245 | $537,112 | $96,133 |
Illustrative projections, not historical trading results or industry averages. Values are rounded to whole dollars.
Revenue grows from $326,726 in 2026 to $633,245 in 2030. With expenses growing more slowly, EBITDA shifts from a $79,831 loss to positive $96,133.
EBITDA excludes depreciation, interest, taxes and investing/financing cash flows. The business can still need liquidity for assets, inventory and payment timing after EBITDA turns positive.
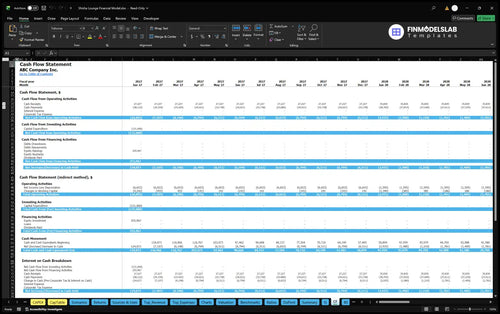
The Cash Flow Forecast tracks operating receipts and payments, asset spending and financing movements through monthly reconciliations. Review it alongside balance sheet cash checks to assess liquidity; this illustration does not establish a tested closing cash balance or prove the opening cushion is sufficient.
Scenario and return reports help assess whether realistic table utilization and prices cover costs and support the planned investment.
Dashboard Low, Base and High multipliers test revenue, COGS, variable costs, fixed costs and payroll. They help assess lower utilization or higher merchant costs without implying verified scenario outcomes.
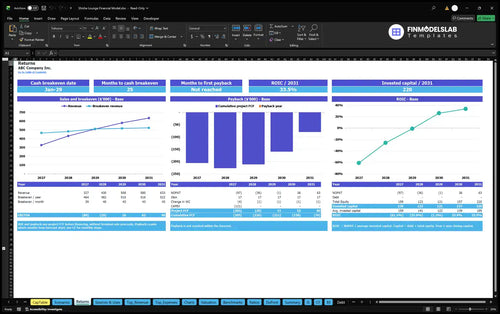
The Returns report separates sales break-even, cash break-even, investment payback and annual ROIC. Sales break-even addresses covering operating costs; payback considers cumulative project cash flow, while ROIC relates operating returns to invested capital rather than equating them with EBITDA.
Use this model to evaluate capacity, spending and investment decisions for an independent tobacco-focused lounge, subject to local approvals.
Adjust table counts, turns, mix, prices, staffing and occupancy budgets for your site. Confirm tobacco permits, age controls, ventilation, insurance and merchant eligibility before committing funds.
Scenarios and Benchmarks enable comparisons; Valuation provides DCF sensitivity; and Checks reviews reconciliations. No valuation, benchmark gap or financing approval is verified for this case.
These answers clarify the workbook mechanics and the limits of its example assumptions.
Revenue uses the available table-session capacity multiplied by utilization, then allocates sold sessions among five packages; it does not add a second independent customer-volume forecast.
Yes. Edit annual prices and the first four package shares; the Celebration package takes the residual so the five session categories total 100%.
No. The Houston illustration excludes alcohol and a full kitchen; bundled tea, fruit and snacks are covered within session package sales.
No. Payroll separately calculates fixed base salaries using annual-average FTE, and the 21% direct-cost and 8.4% variable-cost inputs exclude those wages.
No. The $255,967 funding input is a planning estimate; it excludes external borrowing and unverified processor reserves, and cash sufficiency has not been tested.
No. EBITDA excludes investing and financing cash movements, and the illustrated forecast does not establish cash break-even, payback or a positive closing cash balance.
Yes. Dashboard controls support financing schedules and Low, Base and High operating multipliers, but no external loan or verified alternative-scenario result is supplied in the illustration.
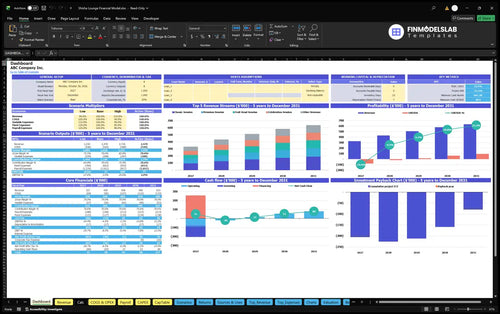
KPIs, forecasts, and cash flow at a glance.
Key assumptions and calculations driving revenue forecasts.
Funding sources, spending, and closing cash.
Cash break-even, payback, and ROIC.
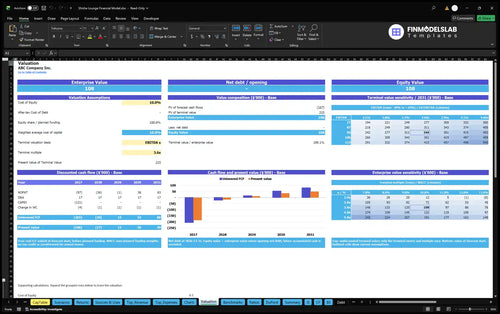
DCF valuation and sensitivity analysis.
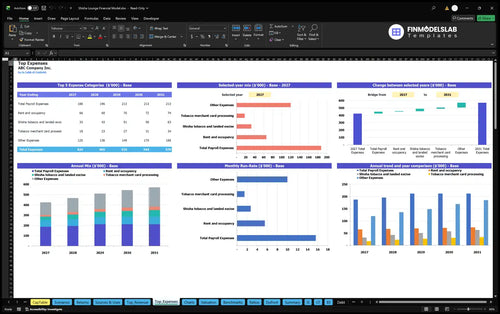
Largest costs and spending trends.
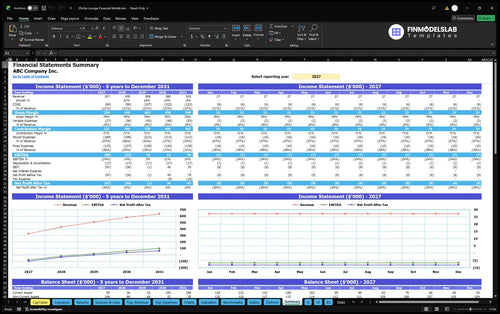
Annual and monthly financial performance.
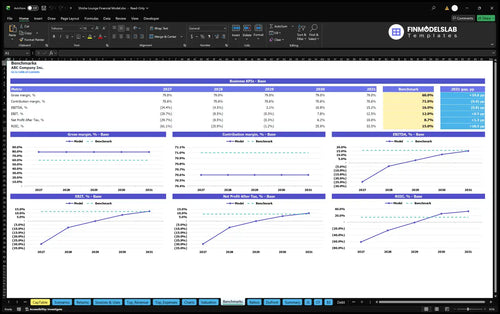
Compare margins and returns to benchmarks.

I didn’t know what investors expected, and this template gave me a clean structure to follow. It saved me days of guessing and helped me walk into conversations with a model I could actually explain.

I was nervous one bad formula would throw off the whole file, but this model stayed easy to follow. That saved me from hours of checking and rechecking every tab.
Building the forecasts by hand was eating up my week, and this template cut that down fast. I finished the financials in an afternoon instead of spending several days on spreadsheets.