

Revenue and Calc
Set daily drinks, service days, five drink prices and shares, launch timing, and seasonality. Monthly Calc allocates one sales pool across categories without double counting.


The Smoothie Bar Financial Model is an Excel template projecting drink sales, ingredients, staffing, EBITDA, startup assets, and funding for a counter-service smoothie bar. Editable assumptions feed monthly calculations, financial statements, and decision reports.
The case covers a leased 1,000-square-foot shop in metropolitan Indianapolis with five exclusive 20-ounce drink categories. Its 2026–2030 forecast uses a January 31, 2026 launch setting. All figures are estimates, not observed performance.
The workbook connects drink-level operating assumptions to financial statements, funding schedules, and decision reports.
Set daily drinks, service days, five drink prices and shares, launch timing, and seasonality. Monthly Calc allocates one sales pool across categories without double counting.
Plan ingredient and packaging rates, transaction fees, acquisition spending, fixed overhead, and salaries by role. Monthly schedules feed the income statement and margins.
Enter equipment, improvements, preopening cash, owner equity, and optional debt. CAPEX, CapTable, Debt, and Sources & Uses separate investment from operations.
Income Statement, Cash Flow, and Balance Sheet provide monthly accounting and liquidity views. Summary, Charts, Top_Revenue, and Top_Expenses explain the main trends.
Dashboard Low, Base, and High controls compare scenarios. Returns, Valuation, Ratios, Benchmarks, and Checks examine break-even, capital returns, reference KPIs, and model reconciliations.
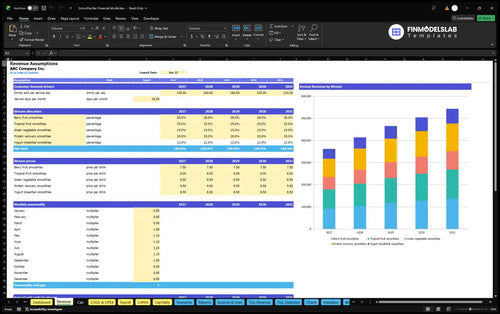
Revenue follows finished drinks sold per service day, a seasonal monthly demand factor, and the prices and shares of five exclusive drink categories.
The example sells 140 drinks per service day in 2026, increasing to 160, 180, 195, and 210 in later years. Each month uses 26 service days, with seasonal multipliers from 0.85 to 1.20.
Berry smoothies account for 28% at $7.50, tropical 25% at $8, green vegetable 15% at $8.50, protein recovery 20% at $9.50, and yogurt breakfast 12% at $8.50. The shares total 100%, producing a $8.295 mix-weighted price per drink.
The Revenue Forecast links drink demand, service days, product mix, and selling prices to annual sales by category. Its monthly calculation schedule applies the repeating seasonality factors before consolidating the five categories into total revenue.
140 daily drinks × 26 service days × 12 normalized seasonal months × $8.295 weighted price ≈ $362,326 annual revenue.
The 12 seasonal factors total 12, shifting demand between months without changing annual volume. Sales are demand-driven; there is no separate capacity ceiling.
The model keeps revenue-linked ingredients and variable charges separate from monthly overhead and fixed salaries, preventing payroll from being counted twice.
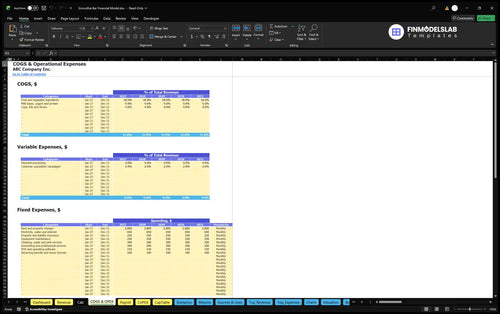
COGS is 31% of sales: 18% produce, 9% milk bases, yogurt, and protein, plus 4% packaging. Processing adds 4% of revenue and customer acquisition 2% as variable expenses.
Fixed overhead is $56,400 annually, including $2,800 per month for rent and property charges, plus utilities, insurance, maintenance, cleaning, accounting, software, and recurring licenses.
The COGS and Operating Expenses forecast separates the 31% direct-cost rate, the 6% variable-expense rate, and recurring fixed overhead. Its monthly expense calculations feed operating margins without embedding the salaries already modeled on Payroll.
| Role | 2026 FTE | 2030 FTE | Annual base / FTE |
|---|---|---|---|
| Working owner-manager | 1 | 1 | $52,000 |
| Smoothie preparation crew | 2.2 | 3 | $33,280 |
Annual-average FTE is a staffing measure, not a count of individual employees; compensation excludes employer taxes and benefits under this case.
The Payroll Forecast tracks owner-manager and smoothie preparation crew roles, annual-average FTE, and fixed base compensation. Crew staffing increases from 2.2 FTE in 2026 to 3.0 FTE in 2030, while the owner-manager remains at one FTE.
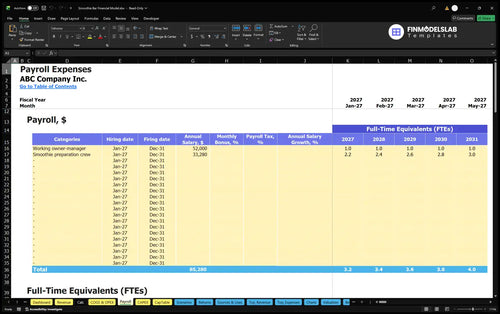
Payroll rises from $125,216 in 2026 to $151,840 in 2030 as crew FTE grows. The owner-manager’s $52,000 base salary is included; personal taxes and employer benefits are excluded.
The example assigns $171,635 of initial owner funding across durable assets, preopening cash outlays, opening working capital, and a three-month reserve.
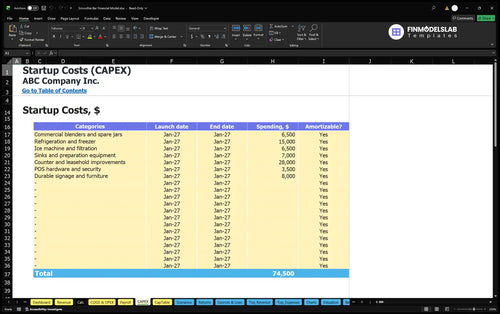
Durable assets total $74,500 for blenders, refrigeration, an ice machine, preparation fixtures, improvements, POS hardware, and signage. Another $15,600 covers preopening deposits, permits, marketing, training, and subscriptions.
The Capital Expenditure Plan schedules smoothie-bar equipment and durable purchases. It separates capital investment from recurring ingredients and tracks depreciation for the financial statements.
| Use of funds | Amount |
|---|---|
| Durable startup assets | $74,500 |
| Separate startup cash | $15,600 |
| Opening net working capital | $2,616 |
| Three-month cash reserve | $78,919 |
| Total owner funding | $171,635 |
Source amounts are rounded to whole dollars for display; the underlying model retains the unrounded funding inputs.
The Sources and Uses of Funds report reconciles funding, startup purchases, and retained cash. Opening capital is owner-funded; optional loan controls do not imply a committed borrowing facility.
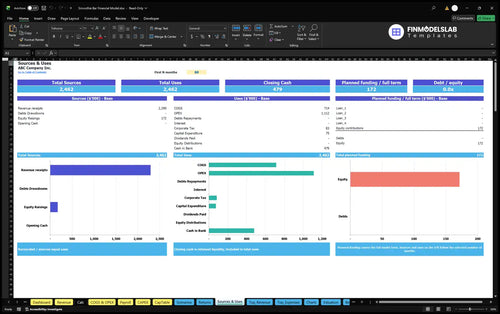
Opening working capital assumes zero receivable days, zero payable days, and 10 inventory days. A reserve is a cash-planning allocation, not an operating expense or proof of cash sufficiency.
Under the selected example assumptions, annual revenue and EBITDA grow as modeled drink demand rises while fixed overhead remains flat.
| Year | Revenue | Operating Expenses | EBITDA |
|---|---|---|---|
| 2026 | $362,326 | $315,676 | $46,649 |
| 2027 | $414,086 | $341,484 | $72,602 |
| 2028 | $465,847 | $367,291 | $98,556 |
| 2029 | $504,668 | $388,311 | $116,357 |
| 2030 | $543,488 | $409,331 | $134,158 |
These are hypothetical operating projections, not observed results. Source figures are independently rounded for display.
Revenue grows from $362,326 in 2026 to $543,488 in 2030, while EBITDA increases from $46,649 to $134,158. This reflects drink mix, demand, revenue-linked costs, fixed overhead, and crew staffing.
Income Statement calculates depreciation, interest, tax, and net profit below EBITDA. However, the supplied operating case documents amounts only through EBITDA, not a specific net profit, valuation, or return.
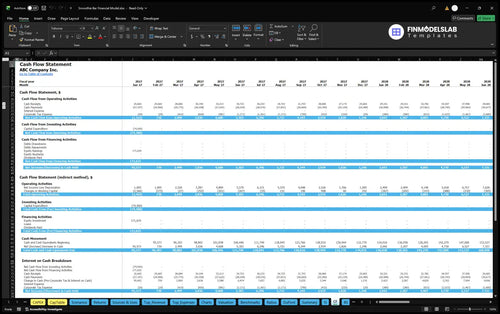
The Cash Flow Forecast reconciles monthly operating, investing, and financing flows with opening and closing cash. Use it alongside Balance Sheet to examine inventory, equipment spending, debt, and potential funding gaps rather than equating EBITDA with liquidity.
Yes. The workbook separates sales break-even, cash break-even, investment recovery, and returns on invested capital rather than treating EBITDA as an investment return.
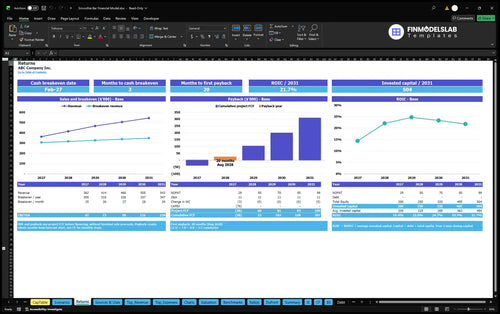
The Returns report distinguishes sales break-even, cash break-even, investment payback, and annual return on invested capital. These respectively examine cost coverage, cash generation, recovery of invested funds, and capital efficiency.
Dashboard Low, Base, and High multipliers adjust revenue, COGS, variable expenses, fixed expenses, and payroll. Scenario comparisons show how demand and cost changes affect margins before lease or staffing decisions.
Four optional debt facilities support amounts, dates, rates, terms, and repayment methods. The example has no committed borrowing; debt coverage, payback, ROIC, and DCF valuation require analysis using completed assumptions.
The template suits operators, prospective owners, and advisers testing the economics of a single independent counter-service smoothie location.
Edit volume, prices, staffing, rent, assets, and funding assumptions. The leased shop opens six days weekly and excludes smoothie bowls, cooked food, delivery apps, franchise charges, and retail supplements. Net revenue excludes sales tax and tips.
Test customized assumptions against statements, scenarios, benchmarks, and checks. The estimates do not guarantee profit, loan approval, cash sufficiency, or returns.
These answers clarify which assumptions are editable and which financial results require further analysis.
Yes. Edit the five 20-ounce drink prices, category shares, daily volume, and monthly seasonality to calculate a different demand-driven revenue forecast.
The Indianapolis illustration assumes 26 service days per month, ten customer-service hours daily, and yearly daily drink volumes from 140 to 210.
No. The documented example covers five blended drink categories only, excluding bowls, cooked food, delivery platforms, franchise fees, and retail supplements.
Yes. The working owner-manager receives a $52,000 annual base salary through Payroll, separate from ingredient COGS, variable expenses, and fixed overhead.
No. The sample assumes approximately $171,635 in owner funding and no committed outside financing, although the workbook includes optional debt controls.
No. EBITDA excludes investing, financing, and working-capital cash movements; review the Cash Flow and Balance Sheet reports to examine liquidity.
No. Returns can calculate break-even, investment payback, and ROIC using completed assumptions, but the supplied example does not establish a verified payback period or return.
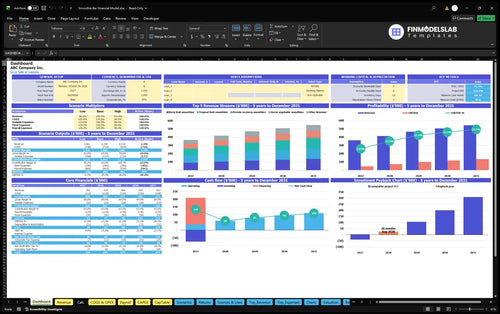
KPIs, forecasts, and cash flow at a glance.
Key assumptions and calculations driving revenue forecasts.
Funding sources, spending, and closing cash.
Cash break-even, payback, and ROIC.
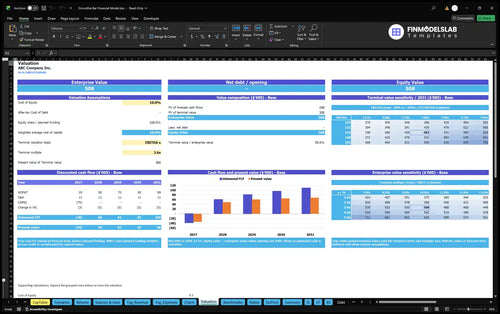
DCF valuation and sensitivity analysis.
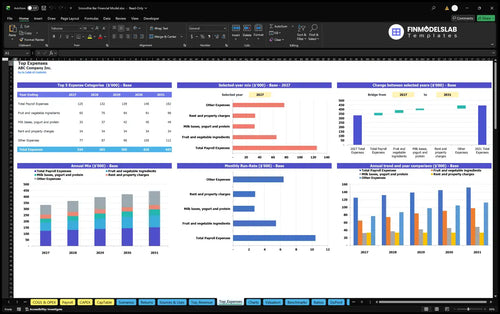
Largest costs and spending trends.
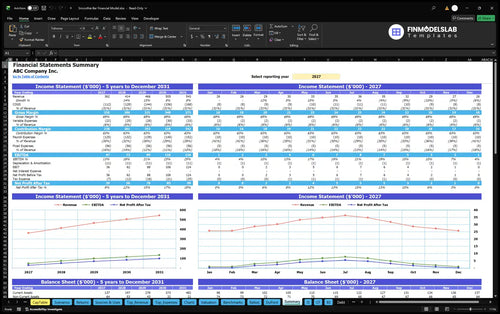
Annual and monthly financial performance.
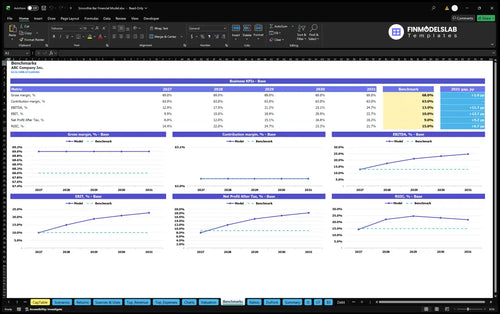
Compare margins and returns to benchmarks.

I used to get stuck on the formulas, but this template made the structure easy to follow. It saved me about 6 hours of setup and let me start planning without hiring a modeler.
The P&L, cash flow, and charts were already organized, so I wasn’t hunting through separate files. That cut my monthly reporting prep by half a day and made the update easier to share.
Switching between low, base, and high cases was straightforward, and the assumptions stayed clean. I booked a planning meeting the same day because the numbers were finally easy to compare.