

Revenue and Calc
Edit operating schedules, throughput, utilization, launch timing, prices, and sales mix; monthly calculations allocate one item pool across five categories.


The Snack Bar Financial Model is an Excel template that turns shared menu-item capacity into monthly sales, operating expenses, staffing costs, and projected 2026–2030 results for an independent counter-service outlet.
The illustrative case covers an 800-square-foot leased Midwest snack bar selling light meals, sides, baked snacks, drinks, and frozen desserts. Franchise royalties, alcohol, delivery marketplaces, catering, and pass-through sales tax are excluded.
The Excel model connects editable operating inputs to monthly calculations, financial statements, and decision-oriented reports.
Edit operating schedules, throughput, utilization, launch timing, prices, and sales mix; monthly calculations allocate one item pool across five categories.
Set ingredients, packaging, processing fees, promotions, overhead, and FTE salaries without counting labor in cost rates.
CAPEX, CapTable, Debt, and Sources & Uses distinguish asset spending, equity, potential debt, and cash allocation.
Income Statement, Cash Flow, Balance Sheet, Dashboard, Scenarios, Returns, and Checks support profitability, liquidity, and reconciliation reviews.
Monthly revenue starts with a single item-production capacity, applies utilization, and allocates sold items across five categories at their net prices.
At 26 service days, 10 hours daily, and 40 items per hour, capacity is 10,400 items monthly. Utilization rises from 55% in 2026 to 75% in 2030; this is item volume, not customer count.
Menu shares are 38% light meals at $8, 20% sides at $4.50, 12% baked snacks at $4, 22% drinks at $3, and 8% desserts at $4.50. Together they produce $5.44 per item.
The Revenue Forecast combines monthly capacity, utilization, menu share, and prices. Calc applies the launch date and assigns each sold item to only one revenue category.
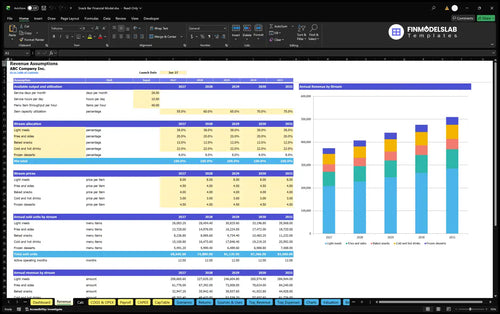
26 days × 10 hours × 40 items × 55% = 5,720 items monthly; 5,720 × $5.44 × 12 months ≈ $373,402 in annual sales.
The forecast separates revenue-linked food costs and transaction expenses from monthly overhead and fixed annual pay.
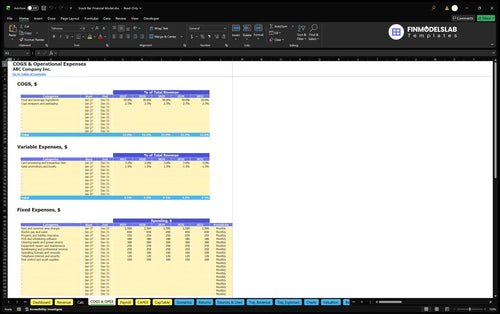
Ingredients are 30% of revenue and packaging 2.5%, totaling 32.5% COGS. Processing fees are 3%, with promotion and loyalty expenses another 1.5% of sales.
Annual fixed costs total $56,400 for rent, utilities, insurance, software, cleaning, repairs, bookkeeping, licenses, connectivity, and supplies. Rent alone is $2,500 monthly.
The COGS and Operating Expenses forecast separates ingredient and packaging rates, sales fees, promotions, and overhead. Changes feed gross margin and operating expenses.
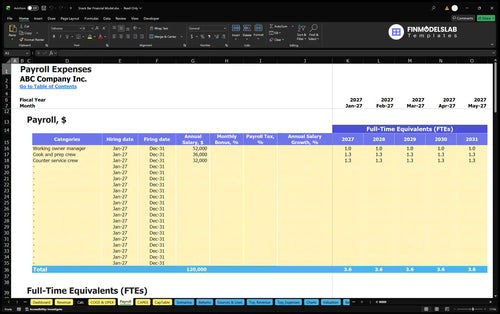
Payroll includes one owner manager at $52,000, 1.3 cook/prep FTE at $36,000 each, and 1.3 counter FTE at $32,000 each: 3.6 FTE and $140,400 annual base pay.
The Payroll Forecast calculates monthly personnel expense by role, FTE, and salary. The base wages are excluded from ingredient, packaging, transaction, promotion, and fixed-expense lines.
$373,402 sales − $121,356 COGS − $16,803 variable expenses − $56,400 fixed expenses − $140,400 payroll ≈ $38,443 EBITDA.
Opening assets, preopening cash needs, and owner contributions are planned separately from recurring expense and EBITDA calculations.
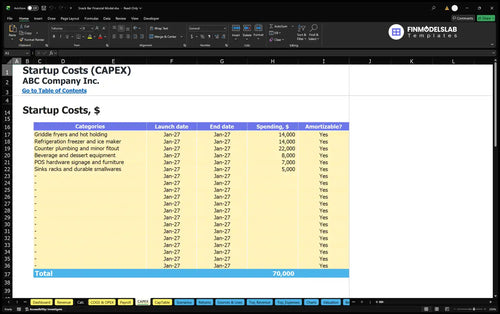
Listed startup assets include $14,000 for cooking equipment, $14,000 for refrigeration, $22,000 for counter fitout, and $8,000 for beverage and dessert equipment: $58,000 combined.
Other asset lines cover POS hardware, signage, furniture, and smallwares. Deposits, permits, setup, preopening training, and launch promotions are separate startup cash items.
The Capital Expenditure Plan schedules opening equipment and fitout purchases, with depreciation where applicable. These investments remain separate from recurring ingredients, rent, and payroll.
The $171,237 owner funding covers estimated opening assets, startup cash, net working capital, and a three-month operating reserve. No committed non-owner financing is assumed.
Working capital uses zero receivable days, seven payable days, and 10 inventory days. Sources & Uses tracks funding and cash allocation; equity contributions are not revenue or EBITDA.
The documented 2026–2030 case increases item utilization while retaining its stated category prices, fixed overhead, and payroll assumptions.
| Year | Revenue | Operating Expenses | EBITDA |
|---|---|---|---|
| 2026 | $373,402 | $334,959 | $38,443 |
| 2027 | $407,347 | $347,518 | $59,829 |
| 2028 | $441,293 | $360,078 | $81,214 |
| 2029 | $475,238 | $372,638 | $102,600 |
| 2030 | $509,184 | $385,198 | $123,986 |
Illustrative estimates rounded to whole dollars; small rounding differences may occur.
As utilization advances five percentage points annually, revenue rises from $373,402 to $509,184 and EBITDA from $38,443 to $123,986. Prices, fixed costs, and Payroll stay unchanged.
Operating expenses include COGS, variable costs, overhead, and payroll. The Income Statement also calculates accounting earnings, but no net-profit or balance-sheet figures were supplied for this case.
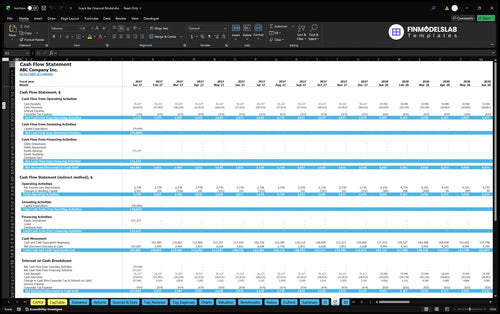
The Cash Flow Forecast reconciles receipts, operating payments, capital purchases, equity, and financing to monthly cash balances. Positive EBITDA alone does not prove liquidity.
The workbook offers distinct calculations for operating coverage, investment recovery, capital returns, and Low, Base, or High assumptions.
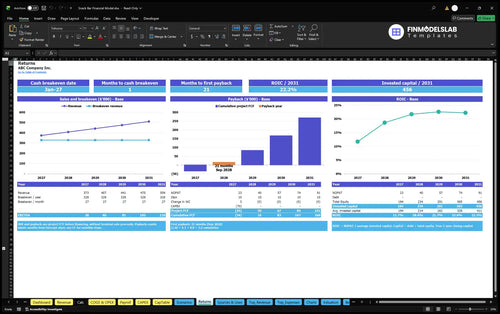
Adjust utilization, pricing, mix, costs, and staffing to evaluate sales break-even. Cash break-even additionally depends on receipts, expenditures, and timing.
The Returns analysis distinguishes sales and cash break-even, investment payback, and annual ROIC. Payback uses cumulative project cash flow; ROIC uses invested capital, not EBITDA alone.
Dashboard multipliers let you compare Low, Base, and High revenue and cost assumptions. No specific payback month or debt terms are established by this example.
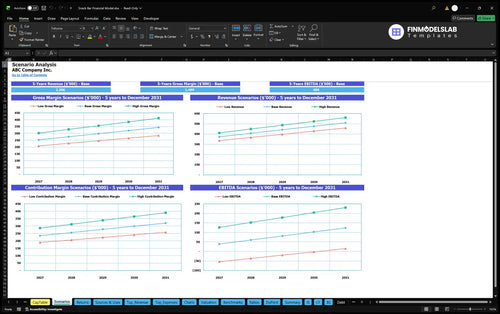
The Financial Scenario Analysis compares Low, Base, and High revenue, gross margin, contribution margin, and EBITDA. These stress tests do not guarantee cash returns or financing.
The template is suited to operators and advisors evaluating a small leased, counter-service snack bar with one shared kitchen-throughput constraint.
Test menu prices, ingredient costs, production capacity, owner pay, and utilization. Dashboard, Summary, Charts, and Checks help review the resulting projections.
This case excludes franchising, catering, delivery marketplaces, and alcohol. Adapt the drivers, funding, and local cost inputs when evaluating a different format.
These answers clarify the editable assumptions, accounting boundaries, and reporting functions of the template.
Yes. Edit prices and category shares in Revenue; the five shares should total 100% so the same item volume is allocated once.
Service days multiplied by hours, hourly menu-item throughput, and utilization determines one monthly sold-item pool, which is then assigned to the five product categories.
No. The January 31, 2026 launch date activates the full selected month; revenue before the launch month is zero.
No. The 3.6 annual-average staff FTE and $140,400 base pay are calculated separately in Payroll, rather than added again to cost percentages.
Yes. The Cash Flow worksheet reports monthly operating, investing, and financing cash movements separately from EBITDA and includes cash reconciliations.
No. The $171,237 is an illustrative owner-equity funding input, not a committed loan, a lender offer, or a guaranteed opening budget.
No. EBITDA excludes depreciation, interest, and income taxes; the Income Statement addresses accounting profit, and Cash Flow addresses cash movements.
Yes. Dashboard controls and the Scenarios worksheet compare Low, Base, and High multipliers for revenue, cost, and payroll assumptions.
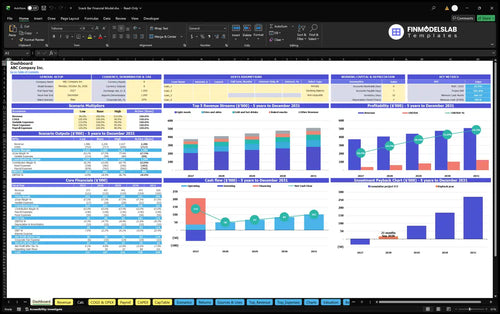
KPIs, forecasts, and cash flow at a glance.
Key assumptions and calculations driving revenue forecasts.
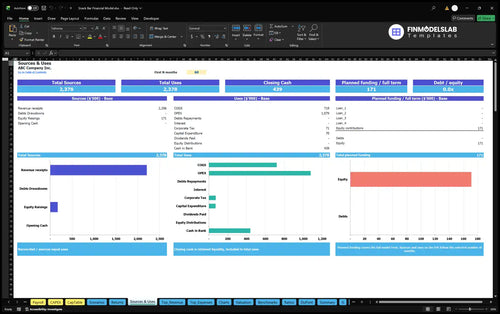
Funding sources, spending, and closing cash.
Cash break-even, payback, and ROIC.
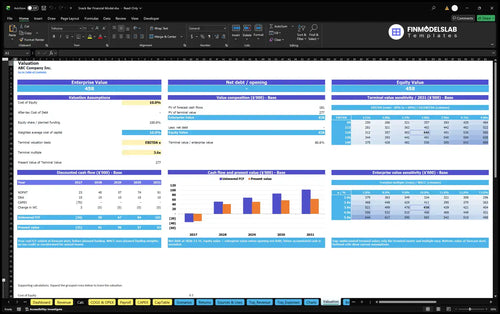
DCF valuation and sensitivity analysis.
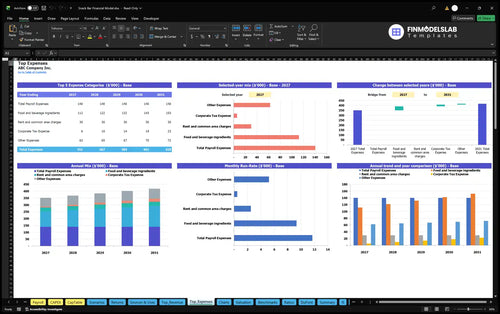
Largest costs and spending trends.
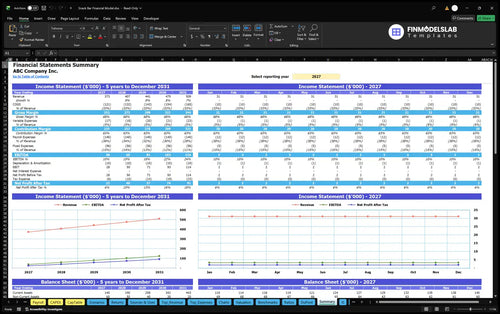
Annual and monthly financial performance.
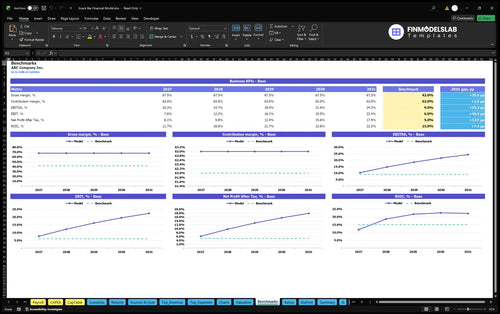
Compare margins and returns to benchmarks.

The built-in checks kept one bad formula from throwing off the whole model, which saved me a full afternoon of troubleshooting. I could trust the numbers again.
I stopped hunting through scattered files for statements and charts, and that alone cut our monthly review prep by about two hours. Everything was organized in one place and easy to walk through.
Pricing, costs, and growth were finally laid out cleanly, so I could update the snack bar forecast without second-guessing each input. It made our next planning meeting much easier.