

Revenue and Calc
Set qualified visits, purchase conversion, items per basket, category shares and prices. Calc applies the launch date and produces monthly sales by coffee category.


The Specialty Coffee Financial Model is an Excel template for estimating a U.S. neighborhood café’s monthly item sales, operating costs and EBITDA across 2026–2030. Editable demand, selling-price and expense assumptions feed the revenue calculations and workbook reports.
The example covers a 1,200-square-foot walk-in coffee bar with 20 seats and a four-FTE team. All results are illustrative estimates, not historical performance or industry averages.
The linked worksheets connect café demand assumptions, expense schedules, opening investment and financial reporting.
Set qualified visits, purchase conversion, items per basket, category shares and prices. Calc applies the launch date and produces monthly sales by coffee category.
Separate beans, ingredients, packaging, card charges and overhead from base salaries for baristas and the working café manager.
Schedule equipment and fit-out investment, owner contributions and optional financing. The example has owner funding but no committed outside loan.
Use financial statements, Returns and Checks alongside Dashboard Low, Base and High scenario controls.
Daily qualified visits, conversion, purchased items per basket and selling days determine monthly sold-item demand.
Qualified visits rise from 600 daily in 2026 to 800 in 2030. Conversion remains 30%, basket volume 1.15 items and selling days 30 monthly. Staffing and equipment are feasibility assumptions, not an additional volume limiter.
One sold-item pool is divided into black espresso drinks (15%), milk espresso drinks (50%), single-origin pour-over (12%), cold coffee (18%) and sealed retail bean bags (5%). Their respective net prices are $3.50, $6, $6, $5.50 and $20.
The Revenue Forecast connects neighborhood demand, conversion, basket size, item mix and net prices to monthly and annual coffee sales. The Calc sheet allocates the single purchased-item pool across all five categories after the selected launch month.
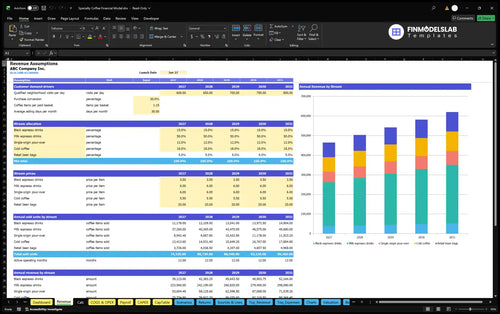
600 visits/day × 30% conversion × 1.15 items/basket × 30 selling days = 6,210 items/month.
At the selected category shares and prices, weighted revenue is $6.235 per item. About 6,210 items a month yield $38,719 of monthly sales and $464,632 of annual 2026 revenue, with each purchased item counted once.
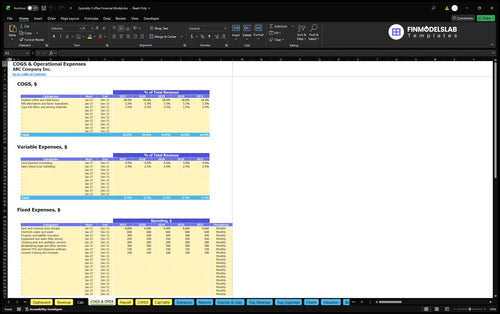
Revenue-linked direct costs and fees are modeled separately from recurring overhead and fixed base salaries.
Direct COGS are 26% of sales: beans 18%, milk and flavor ingredients 5.5%, and serving materials 2.5%. Variable expenses add card processing at 4% and sales-linked marketing at 2.5%.
The illustrated fixed expense plan is $70,800 a year, including $4,000 monthly rent and common-area charges. Other fixed categories cover utilities, insurance, equipment service, sanitation, administrative services, software and licenses.
The COGS and Operating Expenses forecast distinguishes revenue-linked beans, ingredients, materials and card fees from monthly shop overhead. Buyers can test gross and contribution margins without treating rent or payroll as percentages of sales.
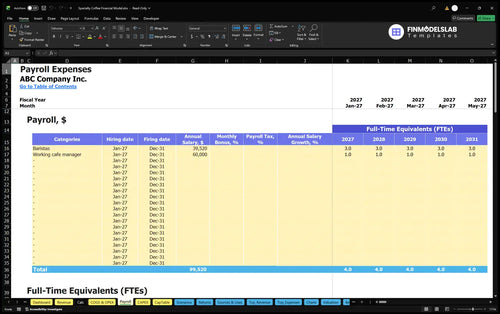
Three barista FTE at $39,520 per year plus one working café manager at $60,000 produce $178,560 in annual base payroll. These salaries are included once in Payroll, not in COGS, variable charges or fixed overhead.
The Payroll Forecast organizes annual-average FTE, salaries and monthly personnel expense by role. It provides a separate place to evaluate the three-barista coverage and working-manager cost as staffing choices change.
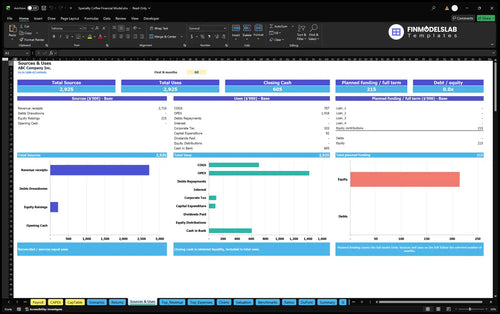
The example estimates $214,746 of owner funding for opening assets, separate cash payments, working capital and a reserve.
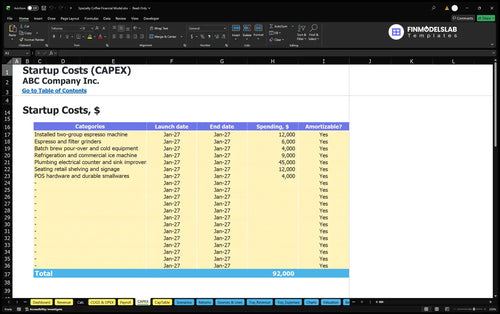
Opening assets include a $12,000 two-group espresso machine, $6,000 of grinders, $4,000 of brewing equipment and $9,000 of refrigeration and ice equipment. Leasehold improvements, seating, signage, POS and smallwares are separate investments.
The Capital Expenditure Plan schedules equipment and fit-out purchases and distinguishes depreciable assets for workbook reporting. The startup assets are not treated as recurring supplies or added to the operating expense totals in the displayed EBITDA forecast.
Other opening cash payments include deposits, permits, website and launch marketing, and preopening training. Working-capital controls assume zero receivable days, seven payable days and 12 inventory days, reflecting point-of-sale payments and stocked coffee supplies.
The Sources and Uses of Funds report traces planned equity, any entered debt and cash allocation across operations and investments. This case uses estimated owner equity only; its three-month recurring operating reserve is a policy, not a verified peak cash requirement.
The 2026–2030 sample projects annual revenue, total operating expenses and EBITDA in U.S. dollars.
| Year | Revenue | Operating Expenses | EBITDA |
|---|---|---|---|
| 2026 | $464,632 | $400,365 | $64,267 |
| 2027 | $503,352 | $412,949 | $90,402 |
| 2028 | $542,071 | $425,533 | $116,538 |
| 2029 | $580,790 | $438,117 | $142,673 |
| 2030 | $619,510 | $450,701 | $168,809 |
Illustrative projections only; amounts rounded to whole dollars. Small differences may result from rounding.
As modeled daily visits increase, annual revenue grows from $464,632 in 2026 to $619,510 in 2030. EBITDA rises from $64,267 to $168,809, with higher revenue-linked expenses but level example fixed costs and base payroll.
These figures describe the documented operating forecast through EBITDA. They do not establish net profit, owner distributions, cash generated, investment payback or whether the opening reserve can cover the worst cash shortfall.
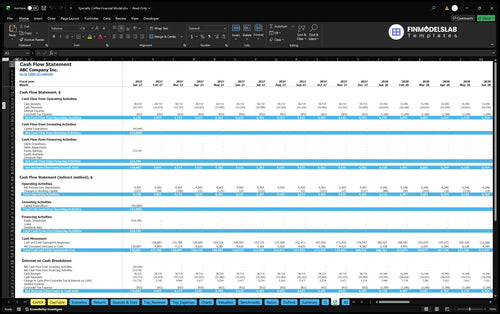
The Cash Flow Forecast separates operating, investing and financing cash movements and reconciles opening to closing cash. It helps evaluate coffee inventory, asset purchases and funding without assuming that positive EBITDA equals cash available to the owner.
Returns and scenario reports help test operating viability and investment recovery without inventing a result for this case.
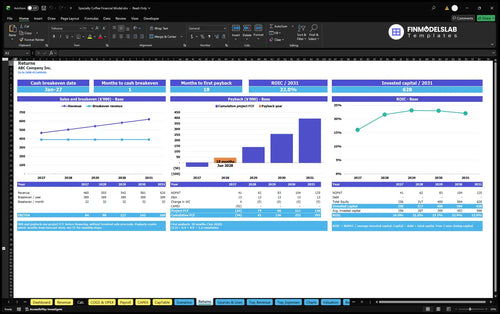
Sales break-even compares revenue with operating costs. Cash break-even examines cumulative project cash flow, payback tracks recovery of invested cash, and annual ROIC relates returns to invested capital; these measures are not interchangeable with EBITDA.
The Break-Even, Payback and ROIC report compares sales with break-even levels, charts cumulative project free cash flow and reviews annual invested-capital returns. The supplied example contains no demonstrated payback date or ROIC percentage.
Dashboard Low, Base and High controls adjust revenue and each main expense group. Scenarios compares operating outcomes; Valuation provides discounted cash flow and sensitivity tools using entered assumptions.
This setup is for an independent U.S. walk-in specialty coffee bar buying externally roasted, traceable beans.
The sample operates ten hours a day in an approximately 1,200-square-foot second-generation leased space with about 20 customer seats. Beverages are prepared on demand, and retail beans are sold in sealed 12-ounce bags.
Roasting, wholesale, delivery platforms, a food kitchen, classes and catering are excluded. These activities require additional sales and expense logic.
These answers clarify editable assumptions, workbook scope and limits of the illustrative example.
Yes. Edit daily qualified visits, purchase conversion, items per paid basket and selling days to recalculate monthly sold-item demand.
Yes. Each category has an editable share and net price, applied to one item pool.
Yes. Three barista FTE and one working manager have base salaries separate from COGS and other expenses.
No. It buys externally roasted beans and sells prepared drinks and sealed 12-ounce bags; roasting and wholesale are excluded.
Yes. CAPEX, funding schedules and working-capital day controls address equipment, opening cash needs, inventory, payables and owner contributions.
Yes. Both are declared workbook reports, although the numeric sample presented here is limited to operating results through EBITDA.
Yes. Low, Base and High multipliers on Dashboard change revenue and expense assumptions for comparison in Scenarios.
No. EBITDA is not free cash flow or investment recovery; review the Cash Flow and Returns schedules under your assumptions.
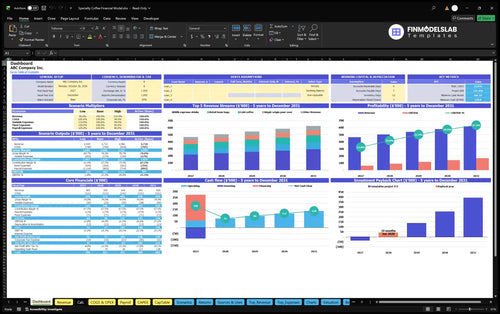
KPIs, forecasts, and cash flow at a glance.
Key assumptions and calculations driving revenue forecasts.
Funding sources, spending, and closing cash.
Cash break-even, payback, and ROIC.
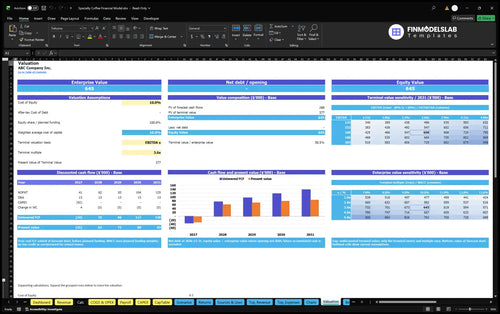
DCF valuation and sensitivity analysis.
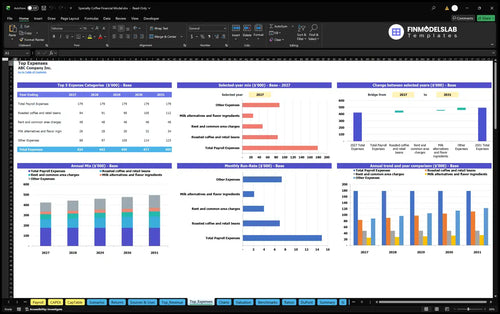
Largest costs and spending trends.
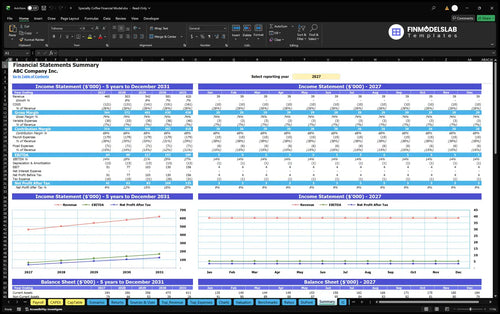
Annual and monthly financial performance.
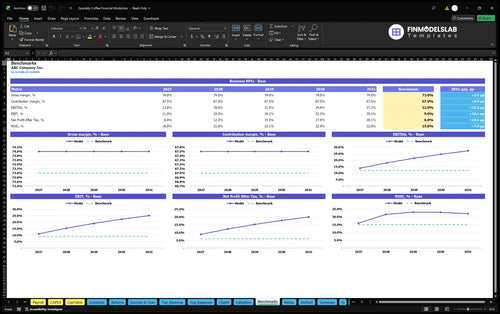
Compare margins and returns to benchmarks.

I stopped chasing charts and statements across different files. Having everything in one template saved me about 6 hours and made the monthly update easy to share.

Switching between low, base, and high cases is straightforward now. I could test pricing changes in minutes instead of rebuilding the model each time.
I finally knew which outputs investors expected and how to present them. The structure made my first meeting feel organized, and we booked a follow-up call.