

Revenue and Calc
Revenue and Calc turn daily visits, conversion, category mix and basket prices into sixty monthly sales forecasts. Each checkout enters one primary category.


This Sporting Goods Store Financial Model builds monthly 2026–2030 projections for a suburban Indianapolis retailer. The Excel template connects traffic, conversion and basket sales to merchandise costs, staffing, opening investment and financial statements.
The example is a leased, 3,000-square-foot store serving recreational and youth sports customers. Sales exclude normal returns, discounts and sales tax; figures are planning estimates, not observed store results.
The Excel workbook connects editable store inputs to monthly reports.
Revenue and Calc turn daily visits, conversion, category mix and basket prices into sixty monthly sales forecasts. Each checkout enters one primary category.
Merchandise, freight, payment fees, promotion and occupancy are separate from payroll for the store manager, sales associates and stockroom support.
Asset purchases, equity and optional debt have separate schedules. Dashboard controls set inventory, receivables and payables timing.
Income Statement, Cash Flow, Balance Sheet, Scenarios and Returns support financial decisions. Checks flags input or reconciliation issues without guaranteeing projections.
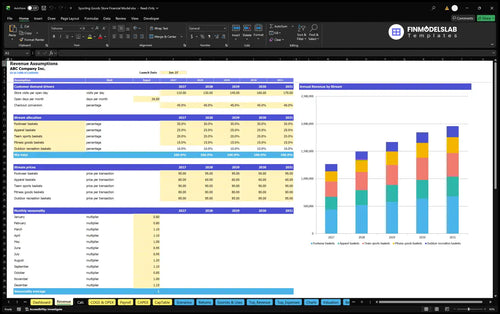
Monthly revenue comes from one visits-to-checkout pool allocated across five mutually exclusive retail basket categories.
Daily visits rise from 110 in 2026 to 170 in 2030. The example uses 26 monthly trading days, 45% conversion, and seasonality of 0.80 in January and February versus 1.20 in August.
The checkout mix is footwear 30% at $95, apparel 25% at $60, team sports 20% at $90, fitness 15% at $80 and outdoor recreation 10% at $85. Accessories remain within their primary basket.
The Revenue Forecast converts visits, open days, conversion, seasonality and five basket prices into monthly category sales. One shared checkout pool prevents double-counting transactions.
30% × $95 + 25% × $60 + 20% × $90 + 15% × $80 + 10% × $85 = $82 per checkout.
At 110 daily visits, 26 open days and 45% conversion, 2026 has 1,287 normalized monthly checkouts before seasonality. The $82 weighted basket and annual seasonality sum of 12.0 yield $1,266,408 in projected revenue.
Operating costs combine merchandise and transaction charges, fixed overhead and separate payroll.
Direct costs total 61.5% of revenue: merchandise 58%, inbound freight 2% and stock loss 1.5%. Separate variable expenses and payroll clarify gross margin, contribution and EBITDA.
The COGS and Operating Expenses report separates merchandise costs, variable transaction charges and fixed overhead. Salaries for the working owner-manager and associates stay in Payroll.
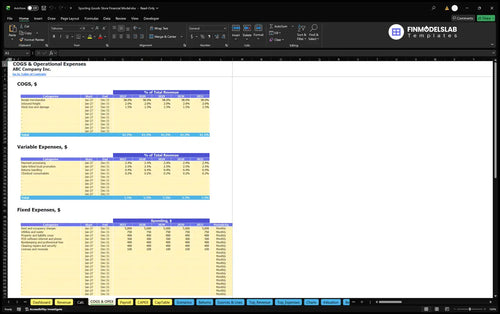
Variable expenses equal 5.5% of sales: processing 2.4%, promotion 2.5%, returns handling 0.4% and consumables 0.2%. Annual fixed costs are $88,200, including $5,000 monthly occupancy plus other overhead.
The Payroll Forecast budgets $56,000 annual base for the manager, $36,000 per associate FTE and a half-time stockroom assistant. Associate staffing rises from 2 to 2.5 FTE by 2030.
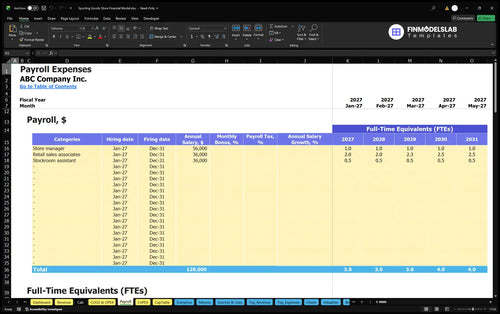
Base payroll is $146,000 in 2026 and $164,000 in 2030, counted once outside other costs. Employer taxes and benefits are excluded from this illustrative case.
Startup assets, preopening cash and inventory working capital differ from operating expenses.
Opening assets include $28,000 in leasehold work, $22,000 in shelving and displays, $3,000 in stock-handling equipment and $6,000 in checkout hardware. Cameras and fitting benches are also listed without separate values.
The Capital Expenditure Plan schedules long-lived fixtures and equipment and their depreciation treatment. It keeps opening asset investment separate from merchandise costs and ongoing rent.
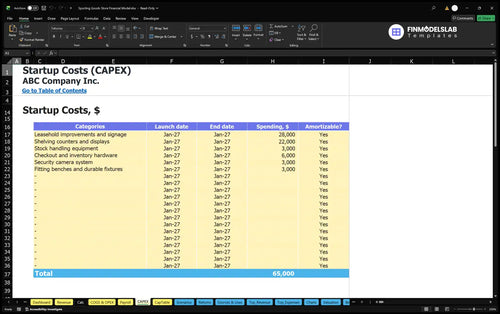
Prelaunch payments cover deposits, permits, setup, marketing and training. Working-capital controls set receivables at 0 days, payables at 15 days and inventory at 116 days, reflecting checkout payment and advance stock purchases.
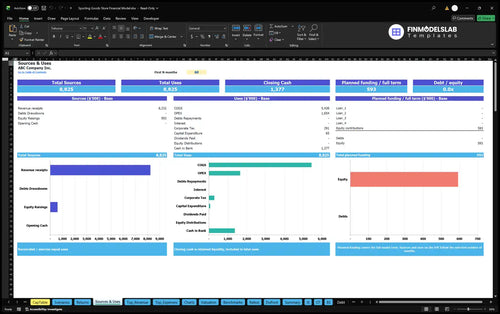
The Sources and Uses of Funds report tracks equity, modeled debt and cash allocations to investment, spending and reserves. This example assumes $592,954 in owner funding and no committed outside financing.
The 2026–2030 example links estimated traffic growth to annual revenue and EBITDA.
| Year | Revenue | Operating Expenses | EBITDA |
|---|---|---|---|
| 2026 | $1,266,408 | $1,082,693 | $183,715 |
| 2027 | $1,496,664 | $1,236,965 | $259,699 |
| 2028 | $1,669,356 | $1,361,669 | $307,687 |
| 2029 | $1,842,048 | $1,486,372 | $355,676 |
| 2030 | $1,957,176 | $1,563,508 | $393,668 |
Forecasts are illustrative planning estimates, rounded to the nearest whole dollar; displayed subtraction may differ by $1 due to rounding.
For 2026, revenue of $1,266,408 less approximately $1,082,693 in expenses yields $183,715 of EBITDA. By 2030, projected revenue reaches $1,957,176 and EBITDA reaches $393,668; neither is actual net income.
The Cash Flow Forecast tracks checkout receipts, inventory and payroll payments, capital spending and financing flows. It shows liquidity under the entered timing assumptions; EBITDA is not cash available to the owner.
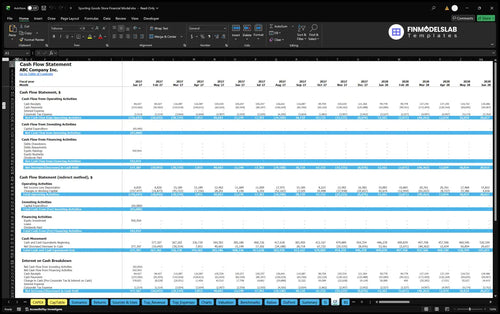
Income Statement, Balance Sheet and Summary show accounting earnings, inventory, payables, debt and cash. No net profit, closing cash or loan results are stated because those outputs were not supplied.
The workbook distinguishes break-even, payback and annual return on invested capital.
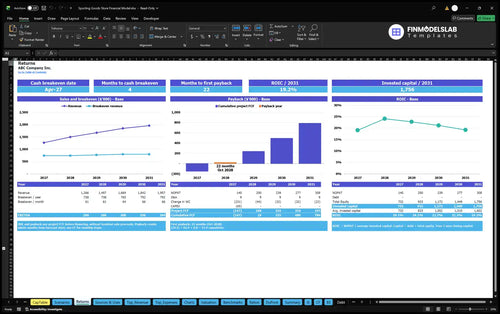
Sales break-even measures revenue needed to cover operating costs. Cash break-even depends on payment timing; payback tracks investment recovery, and annual ROIC compares return with capital invested.
The Break-Even, Payback and ROIC report displays sales requirements, cash timing, investment recovery and annual capital efficiency. No specific payback month or ROIC is supplied.
Dashboard Scenario Controls apply Low, Base and High multipliers to revenue, direct costs, variable costs, fixed costs and payroll. Compare slower sales or higher merchandise costs without treating Base as an industry average.
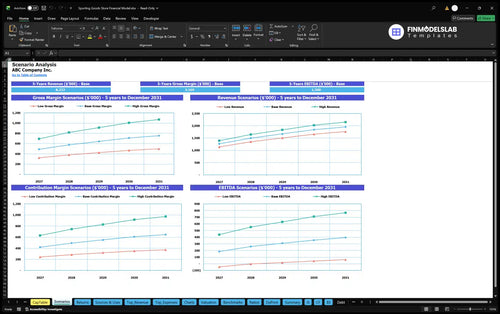
The Financial Scenario Analysis compares Low, Base and High revenue, gross margin, contribution margin and EBITDA. It shows how adjusted sales and expenses affect the modeled outcomes.
Valuation supports DCF sensitivity, while Benchmarks compares entered KPI reference values. Neither establishes a verified market valuation or Indianapolis industry average.
The template helps plan a single retail location and its funding.
Use it to compare staffing, checkout conversion and financial projections for a leased sporting-goods store. The case excludes ecommerce, credit sales, rentals, repairs, firearms, large exercise machines and vehicles.
Replace traffic, basket prices, stock terms, salaries and rent with local inputs. The forecast and planned reserve do not prove future sales or cash sufficiency.
Answers to practical questions about the sales engine, staffing assumptions and financial reports.
Yes. Revenue inputs include estimated visits per open day, 26 open days per month, 45% conversion and seasonal multipliers that can be revised for your store.
No. Each checkout is assigned to one primary footwear, apparel, team sports, fitness or outdoor category; associated merchandise remains within that basket.
The monthly conversion of visits into checkouts uses twelve repeating demand multipliers, including 0.80 in January and February and 1.20 in August.
Yes. The Dashboard includes accounts-receivable, accounts-payable and inventory days; the sample assumptions are 0, 15 and 116 days respectively.
No. Base compensation for the manager, associates and stockroom assistant is calculated in Payroll and is separate from direct costs and operating overhead.
No. EBITDA excludes working-capital movements, capital expenditures and financing cash flows; inspect Cash Flow and Balance Sheet to assess modeled liquidity.
Dashboard Debt Controls provide financing inputs, while Scenario Controls compare Low, Base and High cases; the sample business assumes no committed non-owner financing.
Returns includes operating and cash break-even, investment payback and annual ROIC analysis, but the example does not provide specific payback or return figures.
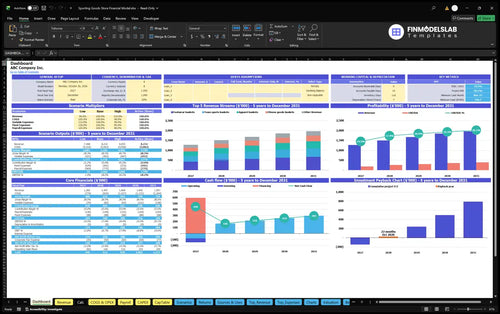
KPIs, forecasts, and cash flow at a glance.
Key assumptions and calculations driving revenue forecasts.
Funding sources, spending, and closing cash.
Cash break-even, payback, and ROIC.
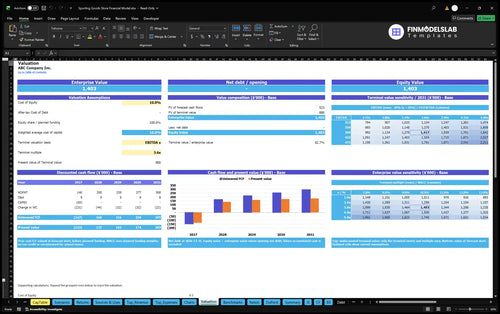
DCF valuation and sensitivity analysis.
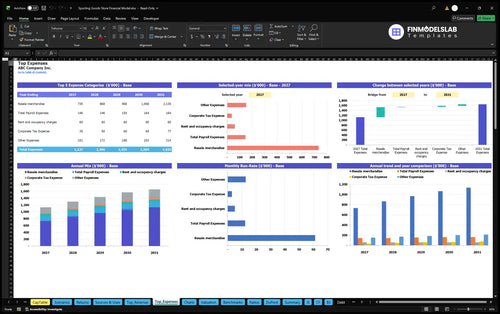
Largest costs and spending trends.
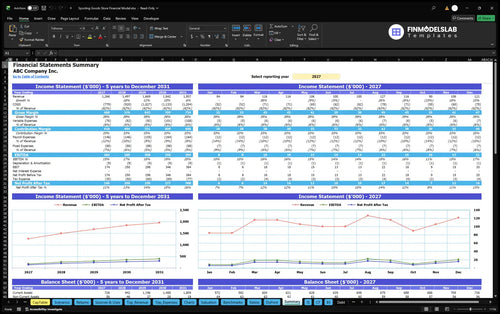
Annual and monthly financial performance.
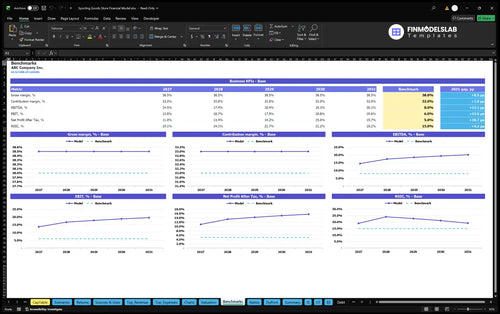
Compare margins and returns to benchmarks.

I’ve always found advanced Excel modeling a bit overwhelming, but this template made the setup easier to follow and edit. It saved me a few hours and helped me build a forecast without second-guessing every formula.
My statements and charts were scattered across different files before this. Now the whole reporting flow is in one workbook, which cut my prep time by half and made my update for the lender much cleaner.
I was nervous that one broken cell would throw everything off, but the layout made checks easy to follow. That gave me a clearer assumption review and saved me from rebuilding the model twice.