

Revenue and Calc
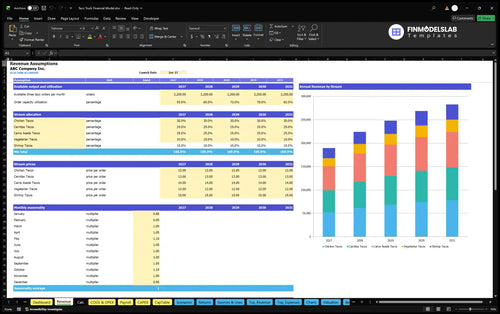
Edit order capacity, yearly utilization, seasonal factors, taco categories, sales shares, and realized prices. Calc applies launch timing and converts these inputs into monthly order volumes and revenue by offering.


The Taco Truck Financial Model is an Excel planning template for an independent U.S. truck selling three-taco orders. It translates available order capacity, utilization, taco mix, realized prices, seasonal traffic, staffing, and operating costs into monthly calculations and 2026–2030 financial projections.
Its illustrative case assumes one truck, two full-time operators including the working owner, and fractional administration. Customers pay when served; the model excludes credit sales, invoiced catering, remitted sales tax, and tips from operating revenue.
The workbook connects food-truck operating assumptions to monthly schedules, financial statements, funding analysis, and management reports.
Edit order capacity, yearly utilization, seasonal factors, taco categories, sales shares, and realized prices. Calc applies launch timing and converts these inputs into monthly order volumes and revenue by offering.
Separate ingredient and packaging costs, sales-linked expenses, monthly overhead, and salaries by role. Effective dates, compensation assumptions, and staffing schedules support the monthly cost calculation.
Plan equipment and other capital purchases, owner contributions, and any financing facilities entered on Dashboard. Supporting schedules track capital spending and financing activity rather than counting startup equity as sales.
Review the workbook’s income statement, cash flow statement, balance sheet, and combined summary. Their report functions extend beyond the specific EBITDA figures documented for the illustrative taco-truck case.
Manage Low, Base, and High assumptions, review projected margins, and examine break-even, investment payback, and return on invested capital. The workbook also includes valuation, charts, ratios, and model checks.
Revenue is driven by one monthly order-capacity pool, planned utilization, a repeating seasonal pattern, and the realized price of each taco order.
The case starts with capacity for 2,200 three-taco orders per month. Utilization rises from 55% in 2026 to 65%, 72%, 78%, and 82% through 2030; twelve monthly seasonal factors shift timing without changing the normalized annual volume.
The Revenue Forecast connects order capacity, annual utilization, five menu prices, product mix, and seasonal factors to projected sales. Its monthly Calc support allocates each sold order to one offering, allowing prices and mix to change the revenue forecast without creating extra orders.
| Menu order | Price | Sales mix |
|---|---|---|
| Chicken Tacos | $12 | 30% |
| Carnitas Tacos | $13 | 25% |
| Carne Asada Tacos | $14 | 25% |
| Vegetarian Tacos | $12 | 10% |
| Shrimp Tacos | $15 | 10% |
Sales shares total 100%; the weighted realized price is $13.05 per order.
2,200 orders/month × 55% utilization × 12 normalized months × $13.05/order = $189,486.
The January factor is 0.85, while selected warmer or busier months reach 1.10. The 2026 base case therefore forecasts 14,520 three-taco orders across the year, with monthly volumes distributed by the entered seasonality pattern.
Direct food costs, sales-linked expenses, recurring overhead, and payroll feed separate operating-expense categories.
Food ingredients are modeled at 31.5% of revenue and disposable packaging at 2%, for total direct costs of 33.5%. Sales-linked expenses include 3.4% payment processing, 6% site fees, and 2% customer marketing, totaling 11.4%.
The COGS and Operating Expenses report separates ingredient and packaging costs from revenue-based selling expenses and fixed monthly overhead. Its inputs cover commissary parking, insurance, utilities, maintenance, software, inspections, communications, and fuel or propane, letting operators evaluate costs independently from payroll.
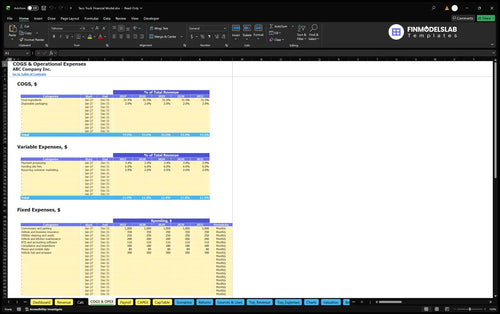
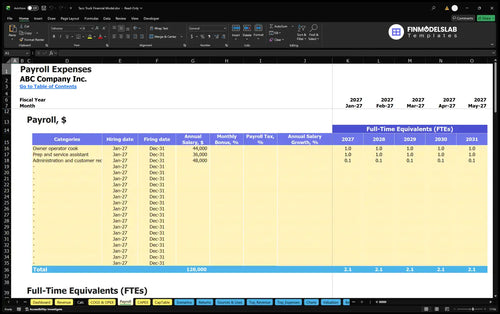
Fixed expenses are $29,640 annually in the illustrated 2026 and 2030 projections, including a $1,000 monthly commissary and parking assumption. The payroll calculation stays separate: the owner-operator earns $44,000, the assistant $36,000, and administration uses 0.1 FTE at a $48,000 annual base rate.
The Payroll Forecast organizes staffing FTE and compensation by role, with timing controls for hires and departures. In this case, 2.1 annual-average FTE produce $84,800 of annual base payroll, counted once and excluded from the other three expense groups.
Opening assets, separate prelaunch cash requirements, and owner equity are modeled distinctly from recurring operating costs and EBITDA.
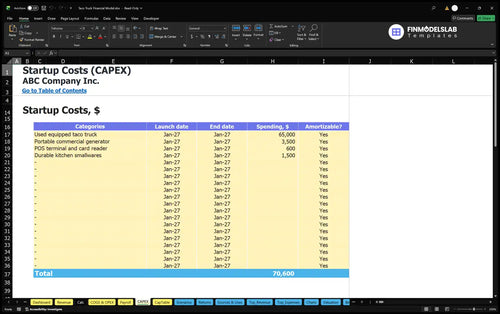
The planned durable equipment is a $65,000 used equipped taco truck, a $3,500 generator, a $600 POS terminal, and $1,500 of kitchen smallwares. Together, these initial asset purchases total $70,600, separate from regular operating expenses.
The Capital Expenditure Plan schedules durable asset purchases and tracks depreciation in the workbook’s supporting schedules. It distinguishes the initial truck and kitchen equipment investment from the recurring ingredients, vending, staffing, and operating overhead used to calculate EBITDA.
Other opening cash items include permitting, a refundable commissary deposit, launch marketing, preopening training pay, and vehicle and food-safety inspections. The case uses zero receivable days, four payable days, and five inventory days to describe physical working-capital timing.
Sources and Uses of Funds helps trace equity or debt sources to operating payments, investment, and cash retained. The initial owner funding assumption is $126,941, reflecting assets, prelaunch cash, opening working capital, and three months of recurring cash operating expenses, with no committed nonowner funding.
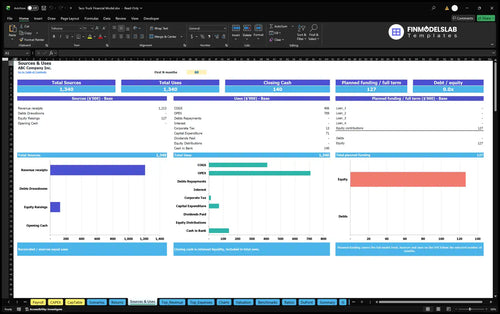
The selected operating assumptions project higher sales and a transition from negative to positive EBITDA over 2026–2030.
| Year | Revenue | Operating Expenses | EBITDA |
|---|---|---|---|
| 2026 | $189,486 | $199,519 | -$10,033 |
| 2027 | $223,938 | $214,988 | $8,950 |
| 2028 | $248,054 | $225,816 | $22,238 |
| 2029 | $268,726 | $235,098 | $33,628 |
| 2030 | $282,506 | $241,285 | $41,221 |
Illustrative planning case; financial amounts rounded to whole dollars. Display rounding may create small differences.
In 2026, operating expenses exceed sales by about $10,033; by 2030, the case projects $41,221 of EBITDA on $282,506 of revenue. These figures result from the selected order-volume path and expense structure, not observed trading results or industry averages.
The Cash Flow Forecast shows monthly operating, investment, and financing cash movements and reconciles opening to closing cash. Use it to assess timing of purchases, owner funding, and potential liquidity gaps; the available illustrative case does not establish a tested closing cash balance.
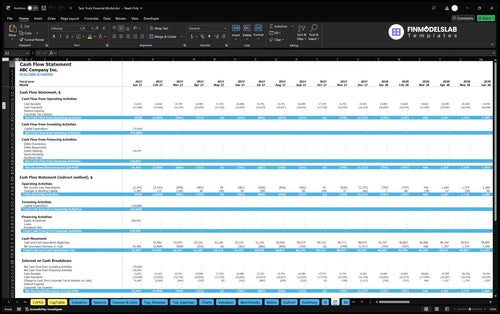
The income statement can also present depreciation, financing costs, taxes, and accounting profit, while the balance sheet tracks cash, working capital, assets, and funding balances. No net profit or balance sheet amount is asserted here from the documented EBITDA-only operating case.
The workbook provides separate tools for operating break-even, cash break-even, investment recovery, annual ROIC, and scenario comparisons.
Sales break-even examines the operating revenue needed to cover costs, while cash break-even tests when cash flows turn sufficient on their own terms. Investment payback measures recovery of the initial investment; annual return on invested capital uses earnings and capital measures rather than treating EBITDA as a return.
The Returns report analyzes sales break-even, cash break-even timing, investment payback, and annual ROIC as distinct measures. These outputs can help test whether higher order utilization compensates for startup investment, but the source case provides no verified payback date or ROIC result.
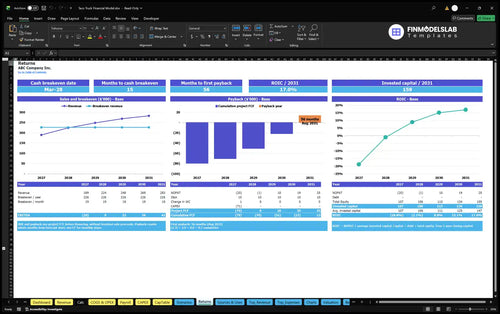
Dashboard scenario controls let you change Low, Base, and High multipliers for revenue, COGS, variable and fixed expenses, and payroll. Scenarios compares resulting revenue, margins, and EBITDA; Valuation and other reports can support additional analysis once their required inputs are reviewed.
These answers explain the template’s inputs, calculations, and the limits of its illustrated results.
Yes. Edit each of the five three-taco prices and mix percentages; the shares allocate the same sold-order volume once.
It uses one 2,200-order monthly capacity pool, yearly utilization, and seasonal factors. No separate demand limiter is applied.
Yes. Monthly seasonal factors distribute projected order volume across the year, and the model applies those factors alongside capacity utilization.
No. Base payroll is calculated separately in Payroll and is excluded from the COGS, variable, and fixed cost assumptions.
No. EBITDA is an operating earnings measure; inspect Cash Flow and financing schedules to evaluate liquidity and funding requirements.
Yes. Dashboard debt inputs, Sources & Uses, cash flow, and Returns support that analysis, but this case does not supply a tested payback date.
No. The 2026–2030 values are illustrative projections based on estimated assumptions, not historical results or national averages.
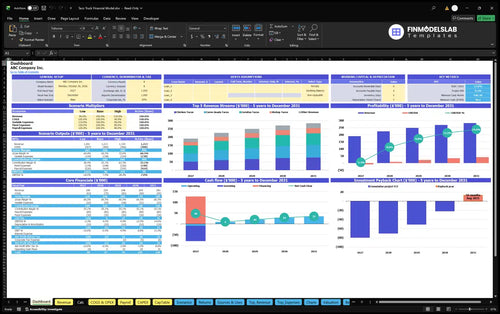
KPIs, forecasts, and cash flow at a glance.
Key assumptions and calculations driving revenue forecasts.
Funding sources, spending, and closing cash.
Cash break-even, payback, and ROIC.
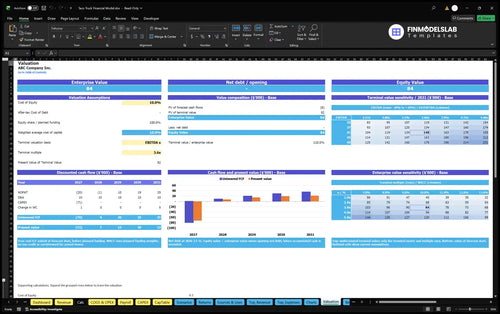
DCF valuation and sensitivity analysis.
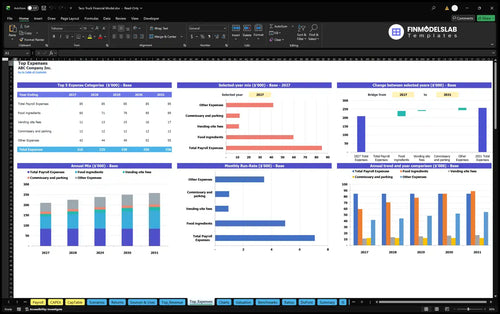
Largest costs and spending trends.
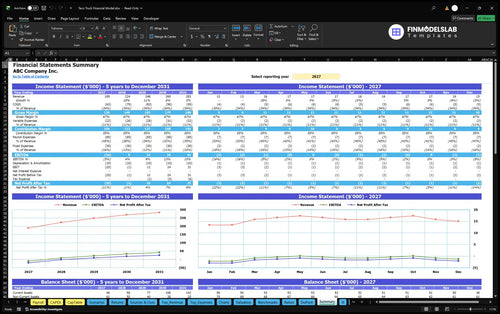
Annual and monthly financial performance.
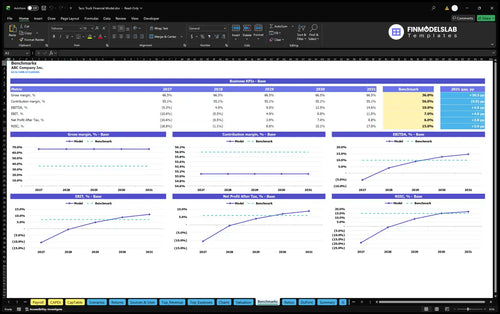
Compare margins and returns to benchmarks.

This template helped me map cash flow month by month, so I could see a shortfall weeks earlier and plan funding with less stress. It saved me about 6 hours of manual forecasting.

Instead of digging through scattered files, I had the P&L, cash flow, and charts in one clean workbook. It cut our monthly reporting prep from a full day to a couple of hours.
I don’t live in Excel, and this model still made sense right away. The input tabs and formulas were clear, so I could build the forecast without hiring help.