

Set Resources
Define practitioner or revenue-producing resource categories, counts by period, service lines, and opening or availability dates.


The Telemedicine Financial Model is an editable five-year Excel and Google Sheets workbook linking practitioner capacity, utilization, service pricing, scenarios, financial statements, and management reports.
Use the workbook to plan practitioner and service-line capacity, utilization ramps, consultation pricing, operating costs, staffing, capital needs, and financing across a five-year forecast.
Editable practitioner and service-line assumptions feed calculations that connect expected service units to revenue, costs, cash flow, financial statements, scenario comparisons, and management reporting.
The model calculates maximum service units from practitioners or revenue-producing resources, applies utilization, prices expected services, respects active months, and totals revenue across service lines.
Define practitioner or revenue-producing resource categories, counts by period, service lines, and opening or availability dates.
Multiply resource counts by maximum monthly treatments or services per resource for each revenue stream.
Apply utilization percentages or ramps to maximum capacity to estimate expected service units.
Multiply expected service units by average realized price and active months for each stream.
Sum calculated revenue across practitioners, revenue-producing resources, and telemedicine service lines for the forecast.
The Revenue worksheet organizes telemedicine services, launch dates, practitioner counts, maximum monthly treatment capacity, utilization, and average service prices that drive revenue.
 REVENUE
The COGS & OPEX worksheet separates practitioner payouts and platform fees, variable operating expenses, and fixed overhead so cost assumptions flow into margins and financial statements.
 COGS & OPEX
The Scenarios view compares Low, Base, and High cases across revenue, gross margin, contribution margin, and EBITDA throughout the five-year telemedicine forecast.
 SCENARIOS
The Dashboard combines scenario controls, core financials, telemedicine revenue mix, profitability, cash flow, and investment payback indicators in one management view.
 DASHBOARD
The ready-made model fits capacity-driven telemedicine forecasts, while materially different revenue logic, operating dependencies, or reporting structures may call for custom modeling.
The template is a planning starting point, not a guarantee of performance.
Financial Models Lab can build or adapt a model when you need different revenue logic, operating schedules, or financial reporting than the ready-made structure.
ORDER A CUSTOM FINANCIAL MODELAfter checkout, you receive the editable Telemedicine Financial Model as an instant download with five-year projections, Low/Base/High scenarios, dashboard reporting, and linked financial statements.
Work in the fully editable Excel or Google Sheets workbook after instant download.
Connect practitioner capacity, utilization, service pricing, costs, staffing, and timing assumptions with financial results over time.
Compare Low, Base, and High cases to see how alternative assumptions change modeled outcomes.
Review the Dashboard together with Income Statement, Cash Flow, Balance Sheet, Summary, and chart outputs.
The essential answers are visible in full, with no accordion clicks required.
It calculates maximum service units from practitioner or resource counts and monthly capacity, applies utilization, multiplies expected services by price and active months, then totals service lines.
You can edit practitioner or resource categories and counts, opening dates, maximum monthly treatments or services, utilization, average prices, active months, service lines, and seasonality when present.
You can compare how alternative cases change revenue, gross margin, contribution margin, and EBITDA across the five-year forecast.
The workbook includes Dashboard, Summary, Income Statement, Cash Flow, Balance Sheet, Scenarios, Charts, and additional reporting tabs.
Yes. Financial Models Lab offers custom financial modeling when you need different revenue logic, operating schedules, or reporting structures.
It is a planning forecast based on editable assumptions, not a guarantee of business performance, financing, profitability, or returns.
Your download includes a comprehensive financial model template in an editable spreadsheet format, complete with a dynamic dashboard, detailed financial statements, and a dedicated assumptions tab.
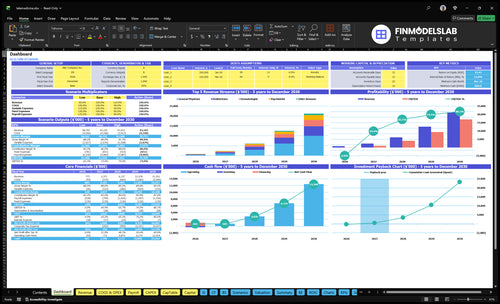
Core inputs and core outputs

Three scenario analysis
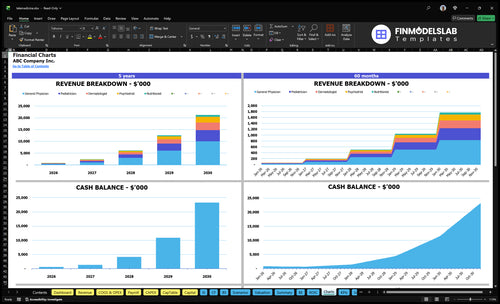
Presentation ready
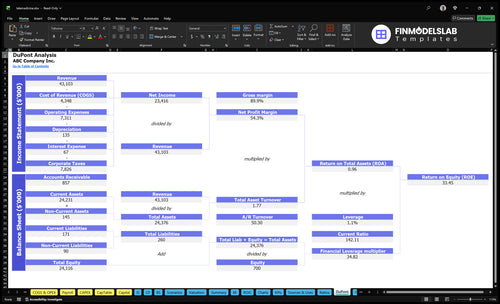
DuPont analysis
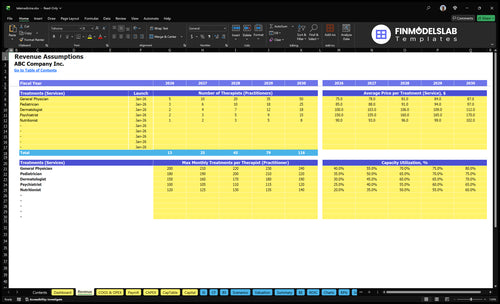
Researched revenue assumptions
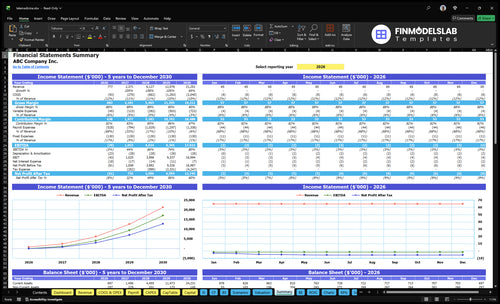
Lender-friendly financial outputs
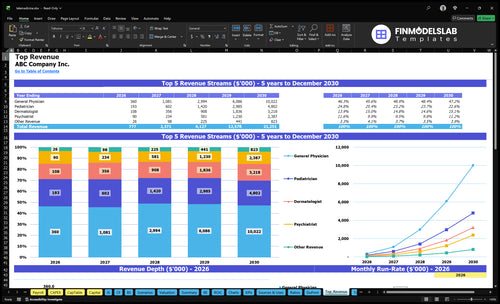
Revenue stream detailed view
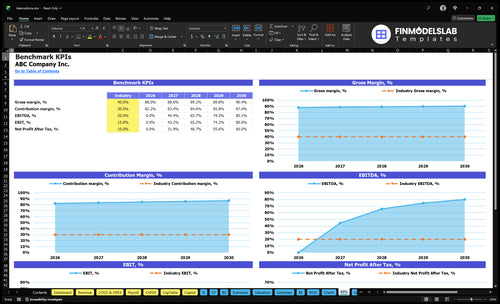
Performance metrics benchmark

This model made our cash needs easier to track, and I could see shortfalls before they became a problem. It saved me hours of guessing and helped us plan funding with more confidence.
I finally had a clean view of margins and break-even instead of piecing it together by hand. It cut our planning time by about half and made the numbers much easier to explain.
Starting from scratch always felt like the hardest part, but this template gave me a structure I could use right away. I had a working first draft in under an hour.