

Revenue and Calc
Set bays, workdays, utilization, seasonal factors, service mix, and effective rates; monthly formulas aggregate six service streams.


The Tire Shop Financial Model is an Excel planning template for an independent tire retailer and service shop. It converts available service-bay hours, utilization, job mix, and effective service prices into monthly revenue, then connects direct costs, operating expenses, and staffing to a five-year financial forecast.
Its illustrative business is a three-bay, approximately 3,500-square-foot shop in the Dayton, Ohio, metropolitan area, opening January 2026. Forecast years run from 2026 through 2030 in US dollars; the supplied example operating results end at EBITDA and are not observed local performance.
The template connects service operations to detailed monthly calculations, financial statements, financing schedules, and management reports.
Set bays, workdays, utilization, seasonal factors, service mix, and effective rates; monthly formulas aggregate six service streams.
Plan tire merchandise, consumables, variable fees, monthly overhead, and technician, manager, and advisor salaries separately.
Record equipment spending, owner equity, and optional financing facilities with their repayment schedules.
Review the income statement, cash flow, balance sheet, and management indicators; the documented numerical example ends at EBITDA.
Compare operating assumptions, examine break-even and investment metrics, and review input and formula checks.
Revenue is capacity-based: usable service-bay hours are allocated to six services and multiplied by each service’s effective revenue per sold bay-hour.
The model starts with three bays, 22 working days per month, and eight available hours per bay per day. Billable utilization increases from 40% in 2026 to 65% in 2030, with repeating monthly seasonal adjustments.
Bay-hours are allocated to passenger tire sets (25%), light truck tire sets (15%), single-tire replacement (10%), puncture repair (15%), rotation and balancing (15%), and alignment (20%). The shares sum to 100%, preventing duplicate hour allocations.
The Revenue Forecast combines editable capacity, utilization, seasonality, service shares, and effective prices to forecast sales by job category. Monthly calculations roll the six streams into annual revenue.

3 bays × 22 days × 8 hours = 528 available bay-hours; 528 × 40% utilization = 211.2 sold bay-hours before seasonality.
January’s 0.85 seasonal factor reduces illustrative sold time to 179.52 hours. Revenue then reflects each service’s allocated hours and net price per consumed bay-hour, with effective rates changing annually.
Months before opening generate no revenue. The January 2026 launch setting counts January as a full operating month, not a partial startup month.
The operating forecast separates tire and repair materials, revenue-linked fees, fixed monthly shop overhead, and role-based base salaries.
Direct costs include landed tire merchandise, valves, weights, and repair supplies. Variable costs include merchant processing, scrap-tire collection, and warranty materials; fixed costs cover rent, utilities, insurance, software, maintenance, licenses, marketing, and site services.
Estimated 2026 tire merchandise costs equal about 56.73% of revenue, with service materials adding about 2.87%. Annual rates and monthly fixed-cost assumptions can be edited.
The COGS and Operating Expenses report separates merchandise and materials from variable charges and recurring overhead. Test how tire purchasing, scrap handling, rent, and other shop costs affect operating margins.
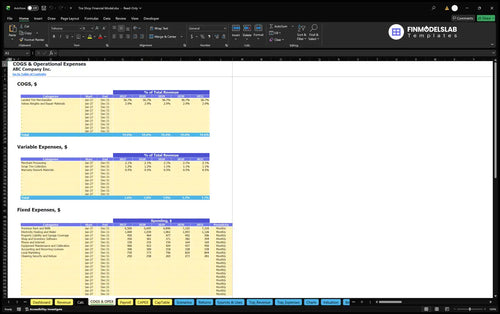
| Expense category | 2026 | 2030 |
|---|---|---|
| COGS | $521,833 | $954,400 |
| Variable expenses | $33,586 | $59,184 |
| Fixed expenses | $121,800 | $137,087 |
| Payroll | $235,500 | $235,500 |
Source forecast amounts are rounded to whole dollars; annual components are not additional costs beyond the total operating expense forecast below.
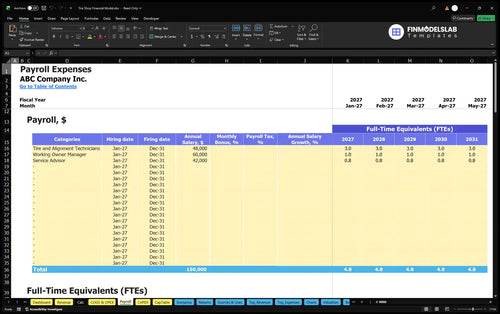
Payroll covers three tire and alignment technicians at $48,000 each, one working owner-manager at $60,000, and a 0.75-FTE advisor with a $42,000 full-time base. Total annual fixed base pay is $235,500.
The example excludes employer taxes, benefits, and personal taxes. Salaries appear in Payroll only, not again in merchandise, variable expense, or fixed overhead.
The Payroll Forecast converts technician, manager, and advisor FTE and salary inputs into monthly personnel spending. Change staffing or compensation without counting wages again in direct costs or overhead.
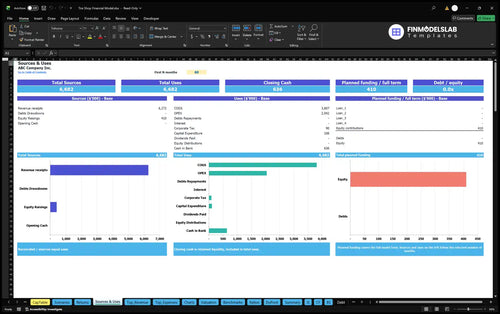
The illustrated opening funding plan separates equipment assets, one-time preopening payments, net working capital, and a cash reserve.
Startup assets total $105,500, including two installed service lifts, a $35,000 alignment system, a $10,000 tire changer, a $7,000 balancer, diagnostic equipment, tools, storage, fitout, and office equipment.
Separate preopening cash of $33,000 covers deposits, legal setup, marketing, training, premises, and utilities. These are opening uses of funds, not recurring operating expenses.
The Capital Expenditure Plan schedules lift, alignment, tire-changing, and balancing investments and tracks applicable depreciation. It keeps equipment purchases distinct from recurring shop costs.

$105,500 assets + $33,000 prelaunch cash + about $42,890 opening net working capital + about $228,180 policy reserve = about $409,570 owner funding.
Opening inventory of about $64,336 less $21,445 supplier credit produces approximately $42,890 net working capital; receivables are zero. Controls assume 45 inventory days, 15 payable days, and zero receivable days.
The $228,180 three-month policy reserve is an estimate, not proven cash sufficiency. The illustrative $409,570 funding is entirely owner equity, with no committed outside financing.
The Sources and Uses of Funds report reconciles planned equity, any modeled borrowing, operating receipts and payments, capital spending, and retained cash. Opening funding is not sales or EBITDA.
The supplied 2026–2030 example shows revenue growth as utilization and effective service rates rise, with EBITDA turning positive after the opening year.
| Year | Revenue | Operating Expenses | EBITDA |
|---|---|---|---|
| 2026 | $875,635 | $912,719 | -$37,083 |
| 2027 | $1,082,285 | $1,047,056 | $35,230 |
| 2028 | $1,277,320 | $1,174,004 | $103,317 |
| 2029 | $1,435,247 | $1,277,437 | $157,810 |
| 2030 | $1,601,500 | $1,386,171 | $215,328 |
Illustrative projections, not historical industry results. Amounts are independently rounded to whole dollars, so displayed differences may not exactly equal displayed EBITDA.
In 2026, $875,635 in projected revenue falls below $912,719 in expenses, yielding an approximately $37,083 EBITDA loss. By 2030, illustrative revenue reaches $1,601,500 and EBITDA reaches $215,328.
These projections stop at EBITDA, not net profit or cash flow. The workbook includes income, cash flow, and balance sheet reports for separate analysis once their relevant assumptions are entered.
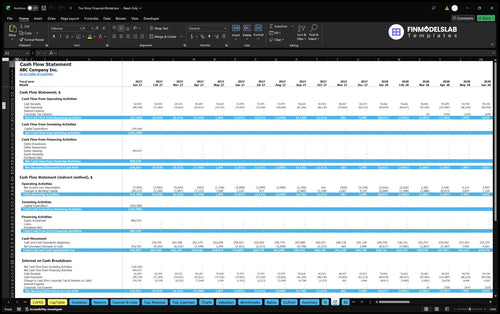
The Cash Flow Forecast reconciles operating, investing, and financing cash movements to opening and closing cash. Review inventory payments, equipment purchases, equity, and modeled debt separately from EBITDA.
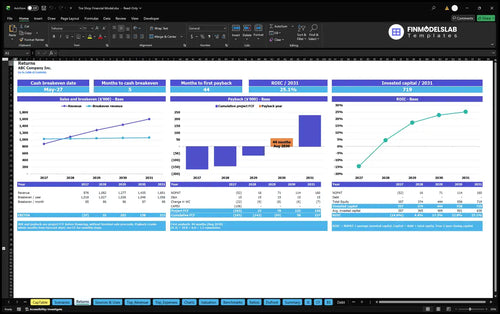
The Returns and scenario reports help evaluate how the shop’s sales capacity and cost structure affect break-even, payback, and capital returns.
Sales break-even measures revenue needed to cover operating costs; cash break-even considers cash timing. Investment payback follows cumulative project cash flows, while annual ROIC assesses returns relative to invested capital.
The supplied EBITDA figures establish no payback month, IRR, ROIC percentage, enterprise value, or loan approval. These metrics require their own financial calculations and inputs.
The Returns analysis separates operating break-even, cash break-even, investment payback, and annual ROIC. Test how utilization, tire margins, staffing, and initial investment change the investment outlook.
The Dashboard offers Low, Base, and High multipliers for revenue and major expenses; Scenarios compares resulting margins and EBITDA. Valuation, sensitivities, ratios, and benchmarks are analysis tools, not verified market evidence.
Replace estimated prices, rent, supplier terms, wages, and operating rates with actual quotes. Use Checks to review inconsistent formulas or missing inputs.
It is designed for an owner or advisor planning a capacity-constrained tire retail and installation operation.
Owners can assess whether three bays support their mix of passenger and light truck tires, repairs, balancing, and alignments. Changing utilization or service shares connects shop decisions to revenue and EBITDA.
The template also helps plan tire stock, supplier credit, equipment timing, and opening equity. All supplied numbers are estimates, not a validated Dayton shop budget.
These answers clarify how to adapt the workbook and interpret its financial projections.
Yes. Edit bay count, working days, available hours, utilization, and seasonality for another shop configuration.
Six categories cover tire-and-installation packages, individual replacements, puncture repairs, balancing and rotations, and alignment, each with its own allocated hours and effective rate.
Yes. The illustrative annual utilization rates are 40%, 48%, 55%, 60%, and 65% for 2026 through 2030.
No. Technician, owner-manager, and advisor salaries belong to Payroll, separate from tire merchandise and materials.
Yes. Cash flow, income statement, and balance sheet reports are included; the supplied numerical operating example extends only through EBITDA.
No. The illustrative $409,570 depends on estimated equipment, preopening costs, working capital, and reserves; use your own budget.
No. Inventory, capital purchases, supplier payables, and financing can affect cash independently from EBITDA.
Yes. Returns covers sales and cash break-even, payback, and annual ROIC, but the example establishes no specific payback period.

KPIs, forecasts, and cash flow at a glance.
Key assumptions and calculations driving revenue forecasts.
Funding sources, spending, and closing cash.
Cash break-even, payback, and ROIC.
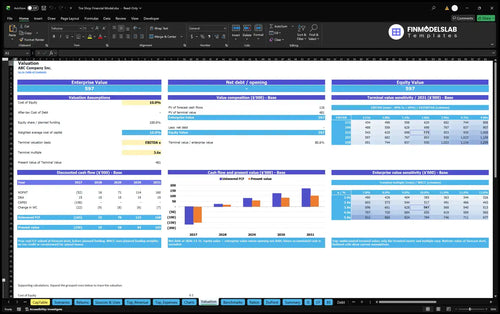
DCF valuation and sensitivity analysis.

Largest costs and spending trends.

Annual and monthly financial performance.
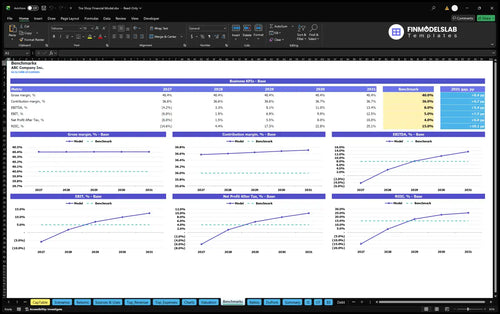
Compare margins and returns to benchmarks.

This tire shop model made profitability easy to see, with margins and break-even laid out in one place. I could test pricing and hit a clearer break-even target in minutes instead of guessing.

I didn’t have to stare at a blank sheet or build every tab from scratch. The pre-built structure helped me get a working plan together in under an hour.
What used to take me a full day of manual spreadsheet work was already built here. I updated the inputs and had clean projections ready for review the same afternoon.