

Revenue and Monthly Calc
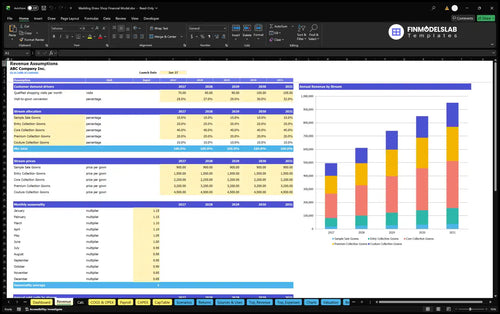
Revenue holds visits, conversion, seasonality, collection shares, and gown prices; Calc produces monthly unit and revenue projections without duplicating purchases.


This Wedding Dress Shop Financial Model is an Excel planning template for a stocked-gown bridal boutique. It converts qualified visits, purchase conversion, collection mix, and prices into monthly sales projections, then connects those sales with costs, staffing, investment, and financial reports.
The illustrated case is a 1,500-square-foot suburban Milwaukee-area store forecasting 2026–2030 from a January 31, 2026 launch. It sells five collections of ready-to-take-home gowns, including basic fitting advice and pressing but excluding alterations, accessories, and made-to-order orders.
The workbook connects bridal-specific drivers with financial statements, funding plans, management reports, and model checks.
Revenue holds visits, conversion, seasonality, collection shares, and gown prices; Calc produces monthly unit and revenue projections without duplicating purchases.
COGS & OPEX separates merchandise, selling costs, and overhead. Payroll schedules staff and salaries; CAPEX tracks store improvements and equipment.
Income Statement, Cash Flow, and Balance Sheet link operating, working-capital, investing, and financing activity. Summary provides annual and selected monthly reporting.
Dashboard contains scenario and debt controls. Returns, Sources & Uses, Valuation, Charts, and Checks support management review.
Qualified visits and conversion set gown unit sales; five collection shares and prices determine revenue.
Appointments and walk-ins form one qualified-visit pool. Visits rise from 70 per month in 2026 to 105 in 2030; conversion increases from 25% to 32%. Each completed purchase is one stocked gown.
Unit shares are Sample Sale 10%, Entry 20%, Core 40%, Premium 20%, and Couture 10%. Their respective gown prices are $900, $1,500, $2,200, $3,200, and $4,500, producing a $2,360 weighted selling price.
The Revenue Forecast links qualified visits, conversion, collection shares, and prices to gown sales. Monthly seasonality then adjusts demand before yearly revenue is aggregated.
70 visits per month × 25% conversion × $2,360 weighted gown price × 12 seasonally weighted months = $495,600 annual revenue.
January and February use 1.15 seasonality multipliers; November and December use 0.85. The twelve monthly factors sum to 12, preserving the annual sales bridge.
Although the launch date is January 31, 2026, the calculation includes the full January month. No alteration, accessory, or custom-order revenue is assumed.
Merchandise costs, selling expenses, fixed overhead, and employee pay are calculated separately.
COGS totals 50% of sales: gown purchases 47%, inbound freight and packaging 1.5%, and damage/write-offs 1.5%. Payment processing at 2.7% and customer acquisition at 4% are variable expenses outside COGS.
The COGS and Operating Expenses forecast isolates merchandise, processing, acquisition, and fixed showroom costs. Its categories explain changes in gross margin, contribution margin, and EBITDA.
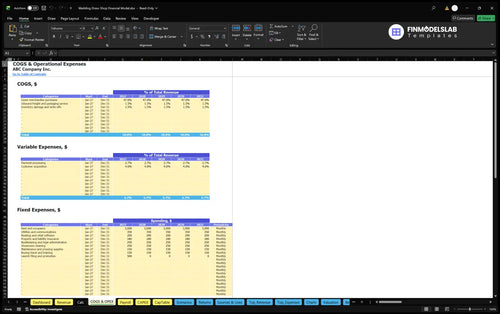
Fixed costs include rent, utilities, software, insurance, administration, cleaning, maintenance, travel, and launch spending. Rent is $3,000 monthly in this example; total fixed expense is $60,360 in 2026 and $54,360 in 2030.
Staff include a manager at $60,000 per year, stylists at $38,000 per annual FTE, and a half-time stock coordinator at $36,000 per FTE. Stylists increase from 1.5 FTE to 2 FTE by 2029.
The Payroll Forecast calculates headcount equivalents and salaries by role. Modeled base payroll changes from $135,000 in 2026 to $154,000 in 2030, and is excluded from merchandise and other operating cost categories.

Store assets, inventory, opening payments, and an operating reserve shape funding needs.
Startup assets include an $18,000 fit-out, $10,000 of racks, mirrors, and furnishings, and $3,500 of POS and pressing equipment. Refundable lease deposits and opening promotion and filing payments are separate cash items.
The Capital Expenditure Plan schedules showroom improvements, store fixtures, and equipment purchases. It also tracks asset depreciation apart from recurring rent, payroll, and merchandise purchases.

Working-capital controls use 116 inventory days, zero receivable days, and zero payable days. Stock is purchased before its retail sale, while the operating forecast itself concludes at EBITDA.
Illustrative opening owner funding is $240,116, including initial stock and a three-month reserve for recurring outflows, with payroll counted once. This policy does not verify peak monthly cash sufficiency.
The Sources and Uses of Funds report reconciles cash from operations, owners, and any financing with investment, operating payments, and cash retained. It separates funding contributions from EBITDA without assuming committed external loans.

The illustrative 2026–2030 plan grows gown sales through more visits and better conversion.
| Year | Revenue | Operating Expenses | EBITDA |
|---|---|---|---|
| 2026 | $495,600 | $476,365 | $19,235 |
| 2027 | $611,712 | $536,201 | $75,511 |
| 2028 | $739,152 | $617,959 | $121,193 |
| 2029 | $849,600 | $690,083 | $159,517 |
| 2030 | $951,552 | $747,890 | $203,662 |
Illustrative financial projections, not historical results or industry averages; rounded to whole dollars.
Revenue rises from $495,600 in 2026 to $951,552 in 2030 as visits and conversion increase. EBITDA moves from $19,235 to $203,662 after direct merchandise costs, variable selling expenses, fixed costs, and payroll.
EBITDA is not net profit or cash flow. Although the Income Statement also contains depreciation, interest, tax, and net profit, the supplied numerical operating example ends at EBITDA.
The Cash Flow Forecast tracks monthly receipts and operating, investment, and financing payments through closing cash. Use it to examine liquidity and funding rather than treating forecast EBITDA as a cash balance.

The Balance Sheet tracks inventory, cash, assets, payables, equity, and debt. Summary and Checks help reconcile monthly and annual financial reporting with the supporting schedules.
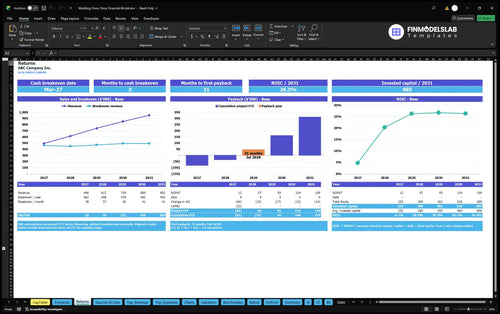
Returns distinguishes covering costs, recovering cash investment, and earning a return on capital.
Sales break-even is the revenue needed to cover operating costs; cash break-even concerns cash timing. Investment payback measures cumulative project cash recovery, while annual ROIC relates returns to invested capital.
The example does not establish a payback month, break-even date, ROIC, or valuation. These require the relevant financial, asset, funding, tax, and scenario schedules.
The Returns analysis separates sales and cash break-even, investment payback, and annual ROIC. It helps assess when the bridal boutique covers costs and whether invested cash is recovered under selected assumptions.
Dashboard offers Low, Base, and High revenue and expense multipliers plus controls for four optional debt facilities. The illustrated initial funding case assumes no committed external lender.
Use this template to test economics for stocked-gown bridal boutiques with appointment-led selling.
Compare higher shopping visits against stronger conversion, shift collection mix toward premium gowns, or test increased stylist FTE. Edited inputs update monthly calculations and financial reporting.
Scenarios, expense analysis, KPI comparisons, ratios, and DCF sensitivity can frame decisions, but their values depend on inputs. The template cannot verify local demand or guarantee investment performance.
Answers about editable inputs, business scope, and the illustrative projections.
Yes. Edit collection prices and shares, visit volumes, conversion, and monthly seasonality to update revenue.
No. Appointments and walk-ins contribute to one qualified shopping-visit pool, and each completed gown purchase belongs to exactly one collection.
No. This stocked-gown model excludes alterations, accessories, and made-to-order orders; an independent tailor works directly with brides.
Yes. Payroll contains role-based FTE and salary assumptions, while COGS & OPEX provides direct, variable, and fixed cost inputs.
No. It is an estimated opening policy, not tested peak cash sufficiency; examine Cash Flow and cash alerts.
No. EBITDA excludes depreciation, financing, and tax effects, and the illustrated annual EBITDA results should not be interpreted as net profit.
Yes. Dashboard supports Low, Base, and High operating cases and optional debt facilities; inspect linked schedules for case-specific results.

KPIs, forecasts, and cash flow at a glance.
Key assumptions and calculations driving revenue forecasts.
Funding sources, spending, and closing cash.
Cash break-even, payback, and ROIC.

DCF valuation and sensitivity analysis.

Largest costs and spending trends.
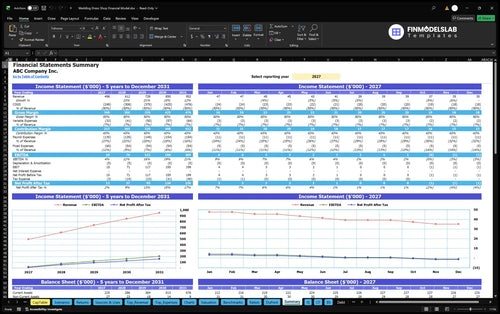
Annual and monthly financial performance.

Compare margins and returns to benchmarks.

This template pulled pricing, costs, and growth into one place so I could stop guessing and explain the numbers clearly. I had a clean assumption set ready for my meeting in under an hour.

I used to spend evenings building wedding shop forecasts by hand, and this cut that down to a single afternoon. The pre-built sheets saved me at least 8 hours on the first pass.
The margin and break-even view made it simple to spot where the shop could lose money and where it could breathe. I left with a clearer plan and a much better sense of when cash would turn positive.