

Weekday Covers
Enter average covers or orders for each weekday in the operating pattern.


An editable five-year Excel and Google Sheets workbook forecasts whiskey and cigar lounge revenue from weekday covers and average checks, with linked scenarios and financial statements.
Use the workbook to turn your opening calendar, guest traffic, average checks, seasonality, and revenue mix into a structured operating and financial forecast.
Changes to editable drivers flow through monthly revenue, cost schedules, scenario comparisons, dashboard reporting, and projected financial statements for planning.
Revenue begins with weekday covers or orders, converts them to monthly volume, applies seasonality and midweek/weekend checks, then allocates and sums category sales.
Enter average covers or orders for each weekday in the operating pattern.
Convert the weekday pattern using operating days, weeks, opening timing, and closures.
Apply monthly seasonality and the relevant midweek or weekend average check.
Allocate modeled sales across food, beverage, takeaway, delivery, or other configured categories.
Sum monthly category sales and any separately modeled ancillary sales to produce total revenue.
The Revenue Assumptions sheet captures opening timing, weekday covers, monthly seasonality, midweek and weekend checks, and category mix that drive lounge sales.
 REVENUE ASSUMPTIONS
The COGS & OPEX sheet organizes direct costs, variable expense rates, and recurring fixed operating expenses that feed projected margins and cash flow.
 COGS & OPEX
The Scenarios view compares Low, Base, and High outcomes across revenue, gross margin, contribution margin, and EBITDA over the five-year forecast.
 SCENARIOS
The Dashboard combines scenario controls, core financials, revenue mix, profitability, cash flow, and payback charts in one management view.
 DASHBOARD
The ready-made model fits a lounge using one shared guest base with covers and average checks; structurally different revenue logic may require custom modeling.
The template is a planning starting point, not a guarantee of performance.
Financial Models Lab can build or adapt a model when you need different revenue logic, operating schedules, or reporting than the ready-made lounge structure.
ORDER A CUSTOM FINANCIAL MODELAfter checkout, you receive an editable Whiskey and Cigar Lounge Financial Model for five-year monthly and annual forecasting, scenarios, dashboard reporting, and financial statements.
Open and edit the financial model in Excel or Google Sheets.
Plan revenue, costs, and financial results across the model’s five-year horizon.
Compare Low, Base, and High cases using the model’s scenario view.
Review the dashboard plus income statement, cash flow, and balance sheet outputs.
The essential answers are visible in full, with no accordion clicks required.
It starts with weekday covers or orders, applies operating timing and seasonality, uses midweek or weekend average checks, allocates sales mix, and sums monthly category revenue.
You can edit the opening date, weekday covers or orders, operating calendar, closures, monthly seasonality, midweek and weekend checks, revenue mix, and ancillary sales assumptions.
The Scenarios view compares Low, Base, and High paths for revenue, gross margin, contribution margin, and EBITDA across the five-year forecast.
The workbook shows a Dashboard plus income statement, cash flow statement, balance sheet, summary, valuation, break-even, ROIC, charts, KPIs, and supporting reports.
Yes. Financial Models Lab can build or adapt a model when your revenue logic, operating schedules, or reporting requirements differ from the ready-made structure.
It is a planning forecast driven by editable assumptions, not a guarantee of revenue, profitability, funding, or business performance.
You get a comprehensive, five-year financial model template in Excel and Google Sheets formats, complete with a financial dashboard, detailed statements, and fully customizable assumptions for your whiskey and cigar lounge.
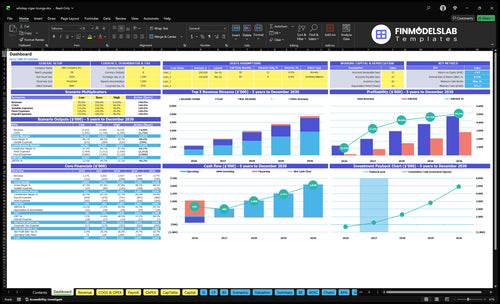
Core inputs and core outputs

Three scenario analysis
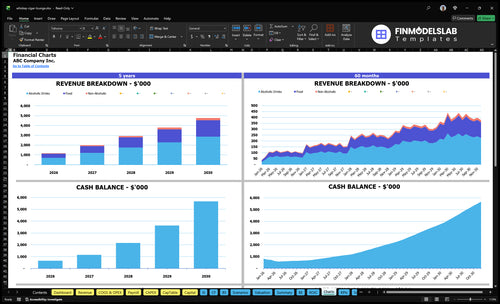
Presentation ready

DuPont analysis

Researched revenue assumptions
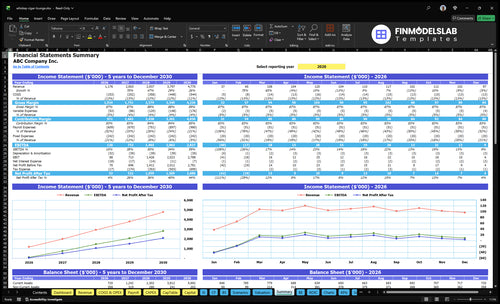
Lender-friendly financial outputs

Revenue stream detailed view
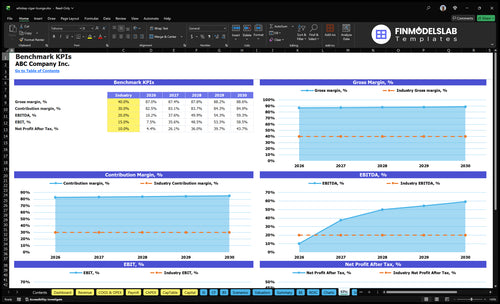
Performance metrics benchmark

This model made margins and break-even easy to see, so I could stop guessing and focus on pricing. We had a cleaner planning call and booked an investor meeting the same day.

Pricing, costs, and growth were finally in one place, which saved me hours of back-and-forth. I could explain the numbers clearly without rebuilding the forecast.
I didn’t have to worry about one broken cell throwing everything off. The structure gave me a safer model to update, and it cut my review time by half.