

Acquire Customers
Divide each online and offline marketing budget by its channel CAC, then add new customers.


This editable five-year workbook connects wine-import customer acquisition, repeat orders, product mix, pricing, costs, scenarios, and core financial statements.
Use the model to plan how marketing-driven customer growth, repeat purchasing, units per order, category mix, and category pricing translate into financial performance.
Editable operating assumptions feed monthly calculations and annual summaries, with scenario views and financial statements updating from the same forecast structure.
The model builds revenue from channel-acquired new customers, repeat-buyer cohorts, order frequency, units per order, product-category mix, and category prices.
Divide each online and offline marketing budget by its channel CAC, then add new customers.
Convert a share of new customers into repeat cohorts active for their stated lifetime.
Add first-purchase orders to active repeat customers multiplied by average repeat orders per month.
Multiply orders by units per order, then allocate the shared unit pool using sales mix.
Multiply allocated category units by category prices and sum category revenue across the forecast.
The Revenue Assumptions view exposes acquisition budgets, CAC, seasonality, repeat-buyer behavior, units per order, category mix, and yearly prices.
 REVENUE ASSUMPTIONS
The COGS & OPEX worksheet separates direct wine and logistics costs from variable operating expenses and recurring fixed expenses.
 COGS & OPEX
The Scenario Analysis view compares alternative cases for revenue, gross margin, contribution margin, and EBITDA across the five-year forecast.
 SCENARIO ANALYSIS
The Dashboard combines scenario controls, key setup assumptions, revenue mix, profitability, cash flow, core financials, and investment payback reporting.
 DASHBOARD
The ready-made model fits businesses using this customer, order, product-mix, and pricing logic; materially different mechanics may require structural customization.
The template is a planning starting point, not a guarantee of performance.
Financial Models Lab can build or adapt a model when you need different revenue logic, operating schedules, or financial reporting.
ORDER A CUSTOM FINANCIAL MODELYou receive a fully editable Excel and Google Sheets financial model with five-year forecasting, scenario analysis, and core financial reporting.
Change revenue, cost, staffing, capital, financing, and model setup assumptions in the spreadsheet.
Review monthly calculations with annual financial summaries across the five-year planning horizon.
Compare Low, Base, and High cases across revenue and major profitability measures.
Use the income statement, cash flow statement, balance sheet, dashboard, and related reports.
The essential answers are visible in full, with no accordion clicks required.
It calculates new customers from channel marketing spend and CAC, adds repeat-customer orders, converts orders to units, allocates units by product mix, and applies category prices.
You can change launch timing, channel budgets and seasonality, CAC, repeat-customer behavior, units per order, category sales mix, and yearly product prices.
You can compare how alternative cases affect revenue, gross margin, contribution margin, and EBITDA across the five-year forecast.
The product page confirms an income statement, cash flow statement, balance sheet, dashboard, scenario analysis, summary, and additional financial reports.
Yes. Financial Models Lab offers custom financial modeling for different revenue logic, operating schedules, and reporting requirements.
It is a forecast based on editable assumptions, not a guarantee of business performance, profitability, financing, or returns.
This powerful Excel and Google Sheets template includes a 5-year financial forecast, startup cost calculator, and an interactive dashboard tailored for a wine importing business.
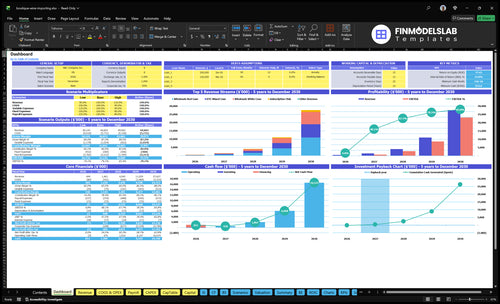
Core inputs and core outputs
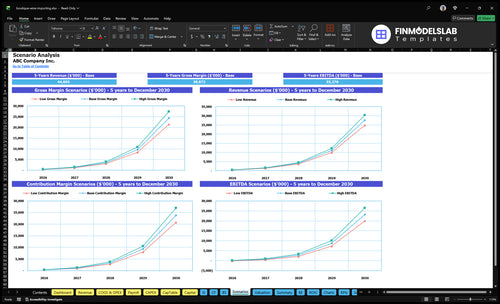
Three scenario analysis
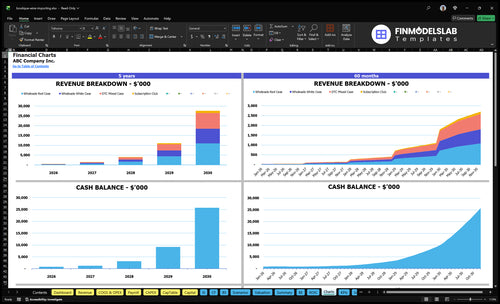
Presentation ready
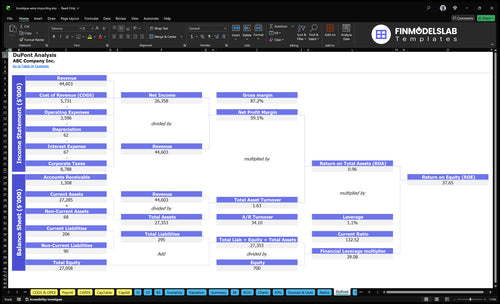
DuPont analysis

Researched revenue assumptions
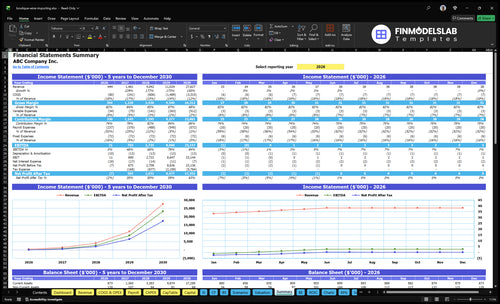
Lender-friendly financial outputs
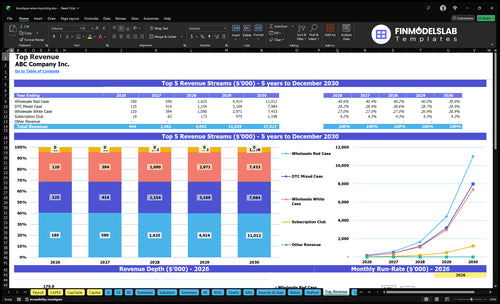
Revenue stream detailed view
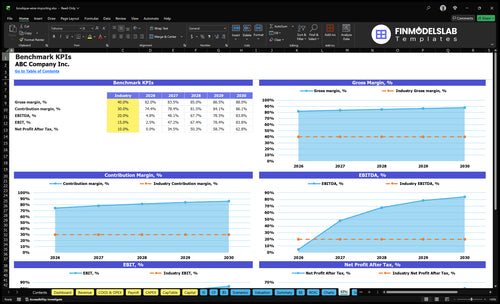
Performance metrics benchmark

The built-in P&L made margins and break-even easy to see, so I stopped guessing at profitability. I saved about 4 hours of spreadsheet work and had cleaner numbers ready for my lender call.

Running low, base, and high cases was straightforward instead of a half-day chore. I compared all three in one file and booked a planning meeting the same afternoon.
I wasn't staring at a blank sheet anymore; the template gave me a solid starting point for the wine import business. I built my first working model in under a day and felt ready to refine it.