

Revenue and Calc
Enter qualified website sessions, checkout conversion, net garments per order, seasonal factors, category mix, and realized prices. Monthly calculations allocate one garment demand pool across six clothing categories.


The Clothing Line Financial Model is an Excel financial planning template for a direct-to-consumer apparel brand selling its own casual clothing collection online. It connects website demand, checkout conversion, garments per order, seasonal demand, category pricing, manufacturing costs, fulfillment, and staffing to a five-year operating forecast.
The illustrated case uses a Columbus, Ohio design office, outsourced cut-and-sew production, and a U.S. third-party logistics provider. It does not assume an owned factory or physical retail store, and the example financial projections are planning estimates rather than historical results.
The workbook connects adjustable apparel operating assumptions to monthly schedules, financial statements, funding analysis, and management reports.
Enter qualified website sessions, checkout conversion, net garments per order, seasonal factors, category mix, and realized prices. Monthly calculations allocate one garment demand pool across six clothing categories.
Plan contract production, packaging, replacements, payment fees, advertising, fulfillment, returns, fixed overhead, and four salaried roles without double-counting expenses.
Specify equipment and other capital purchases, opening equity, available debt facilities, and working-capital assumptions. Supporting schedules track depreciation, financing, and cash allocation.
Review the projected Income Statement, Cash Flow Statement, and Balance Sheet, plus a combined Summary. These standard reports calculate beyond the operating EBITDA amounts documented for the example case.
Use the Dashboard, Low/Base/High scenarios, Returns, Valuation, Benchmarks, Charts, and reconciliations to examine business performance, investment questions, and model consistency.
Monthly sales come from qualified online sessions, checkout conversion, net retained garments per order, and seasonal demand factors.
The Base case starts with 50,000 qualified sessions per month and a 1.8% checkout conversion rate in 2026, rising to 130,000 sessions and 2.2% conversion in 2030. Net retained garments per order increase from 1.4 to 1.5 over the forecast.
The model applies the calendar-month seasonality multiplier once, then assigns sold garments to T-shirts, crewnecks, hoodies, joggers, woven shirts, and caps. Each category receives its own realized selling price, so sales mix directly affects total revenue.
The Revenue Forecast lays out apparel sales drivers, unit demand, realized selling prices, and annual sales by category. Changing sessions, conversion, seasonality, or product mix flows through the monthly Calc schedule into projected revenue.

50,000 sessions × 1.8% conversion × 1.4 net garments per order × 0.80 seasonal factor = 1,008 garments.
In 2026, T-shirts represent 32% of net garments at $32 each, while crewneck sweatshirts are 20% at $64 and hoodies 18% at $78. Joggers, woven shirts, and caps make up the remaining 30%; all six shares total 100%.
The forecast counts apparel direct costs, variable selling expenses, fixed overhead, and role-based payroll as separate operating cost groups.
Direct costs use 36% of revenue for landed contract apparel, 1.5% for branded packaging, and 0.5% for quality replacements. Variable expenses include 15% performance marketing, 9% fulfillment and shipping, 3.6% processing, 3% returns handling, and 0.3% credit losses.
The COGS and Operating Expenses report separates production-related costs from variable selling expenses and fixed overhead. It helps identify how supplier costs, order fulfillment, advertising, and studio expenses influence the margin left after each cost group.

| Cost category | 2026 | 2030 |
|---|---|---|
| COGS | $310,722 | $1,262,166 |
| Variable expenses | $252,666 | $1,026,340 |
| Fixed expenses | $57,000 | $77,400 |
| Payroll | $120,950 | $236,250 |
Rounded values are from the example operating forecast; each payment component is included only once.
Fixed expenses cover the design studio, 3PL storage minimum, software, insurance, professional services, supplies, and collection development. Studio rent is estimated at $1,800 per month in 2026 and $2,000 per month in 2030, with 12 paid months annually.
The Payroll Forecast organizes staff roles, annual-average full-time equivalents, base salaries, and the monthly personnel cost schedule. The case includes an apparel designer, owner and operations lead, customer support, and marketing coordinator, with FTE plans changing by forecast year.
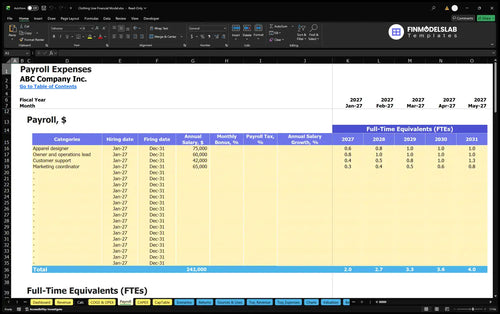
The 2026 example budgets 0.6 designer FTE and 0.75 owner/operations FTE, expanding support and marketing staffing as sales grow. Base pay is entered per full-time equivalent; employer taxes and benefits are excluded from the documented operating case.
Startup equipment, prelaunch payments, inventory funding, and owner equity are modeled separately from annual operating expenses.
The opening asset plan includes $2,500 of sample sewing equipment, $1,200 of cutting and fitting equipment, $4,000 of studio furniture and racks, and $2,500 of photography equipment, plus computers. Separate prelaunch cash needs include legal setup, deposits, collection development, launch creative, and website setup.
The Capital Expenditure Plan records asset purchase budgets, spending dates, depreciation treatment, and resulting asset balances. It distinguishes sewing and fitting equipment, furniture, photography gear, and other capital purchases from the ongoing operating cost forecast.

Working-capital controls assume zero accounts-receivable days, 15 accounts-payable days, and 90 inventory days. These inputs matter for purchasing inventory before customer sales and for the timing of supplier payments and cash requirements.
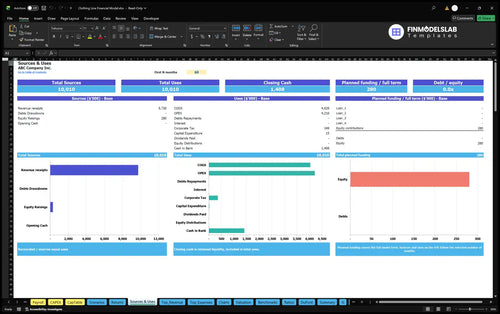
The Sources and Uses of Funds report reconciles cash inflows, funding, operating payments, investments, and cash retained in the business. Use it to trace how opening equity and any modeled debt support the clothing collection and its ongoing funding needs.
The example operating forecast covers 2026 through 2030 and ends at EBITDA, not net income or free cash flow.
| Year | Revenue | Operating Expenses | EBITDA |
|---|---|---|---|
| 2026 | $817,690 | $741,338 | $76,351 |
| 2027 | $1,262,883 | $1,095,176 | $167,707 |
| 2028 | $1,850,386 | $1,540,516 | $309,870 |
| 2029 | $2,477,558 | $1,995,038 | $482,521 |
| 2030 | $3,321,490 | $2,602,156 | $719,333 |
Illustrative projections, rounded to the nearest dollar; displayed totals may differ slightly due to rounding.
In the supplied Base case, modeled annual revenue rises from approximately $817,690 in 2026 to $3,321,490 in 2030. EBITDA increases from approximately $76,351 to $719,333 as the online demand forecast scales; these are assumptions-driven outputs, not guaranteed performance.
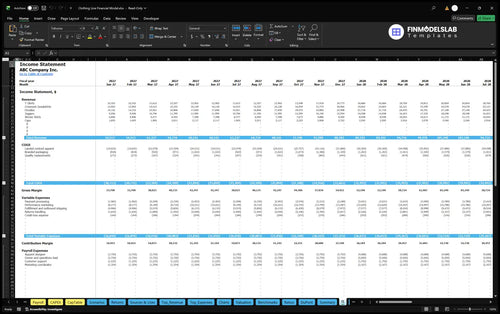
The Projected Income Statement connects revenue and operating costs to gross margin, contribution margin, EBITDA, and subsequent accounting expense lines. The documented example provides numerical results through EBITDA only, so it does not establish net profit or tax results.
Operating EBITDA does not measure available cash. Inventory purchases, payables, startup investment, equity, and possible debt can change liquidity even in years showing positive EBITDA; the workbook provides separate schedules to examine these effects.
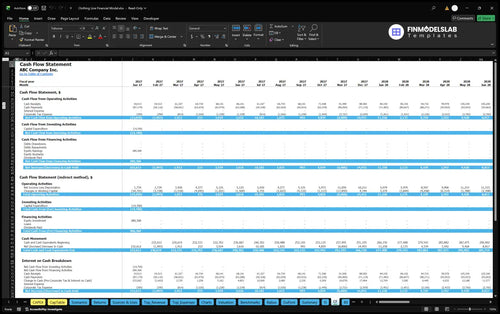
The Cash Flow Forecast organizes monthly operating, investing, and financing cash movements and reconciles beginning and ending cash. It helps review inventory funding, capital purchases, owner contributions, and debt activity separately from the apparel brand’s operating earnings.
The workbook offers separate views of operating thresholds, cash recovery, investment returns, and Low/Base/High operating cases.
The Returns sheet distinguishes the revenue needed to cover operating costs from the point when cumulative project cash flow turns positive. Investment payback measures cash recovery, while annual return on invested capital compares operating returns with invested funding; they are not interchangeable.
The Break-Even, Payback and ROIC report brings together sales break-even, cash break-even, investment payback, and annual return on invested capital. These calculations are designed to assess different operating and funding questions, not to convert EBITDA automatically into a payback period.
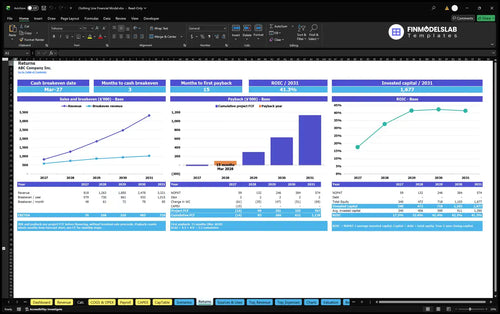
Dashboard scenario controls adjust revenue, direct costs, variable expenses, fixed expenses, and payroll for Low, Base, and High cases. Valuation provides discounted cash flow and sensitivity analysis, while Benchmarks compares workbook KPIs against entered reference values; the supplied case does not specify those results.
Answers to common questions about tailoring this apparel financial planning workbook to your own business.
Yes. Adjust realized prices and the percentage mix across the six apparel categories in Revenue; the monthly calculations recalculate projected sales.
No. The documented operating case uses contract cut-and-sew manufacturing and a U.S. third-party fulfillment provider rather than an owned factory or retail store.
It multiplies qualified sessions by checkout conversion, net garments per order, and the applicable monthly seasonal factor, then allocates garments across categories once.
Yes. The Payroll sheet supports staffing by role, annual-average FTE, pay assumptions, hiring dates, and monthly personnel costs.
Yes. The case models outbound fulfillment and shipping at 9% of revenue and performance marketing at 15%, plus processing, returns, and other expense categories.
No. Cash Flow separately tracks operating, investing, and financing movements, including inventory and funding timing that EBITDA does not capture.
No. The supplied case reports operating results through EBITDA. Payback, net profit, and cash sufficiency require review of their distinct workbook outputs and assumptions.
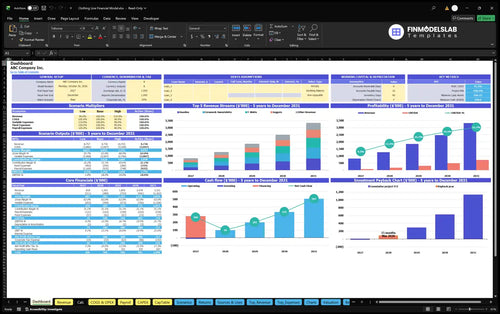
KPIs, forecasts, and cash flow at a glance.
Key assumptions and calculations driving revenue forecasts.
Funding sources, spending, and closing cash.
Cash break-even, payback, and ROIC.
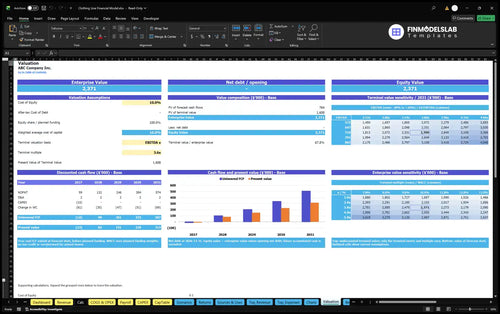
DCF valuation and sensitivity analysis.
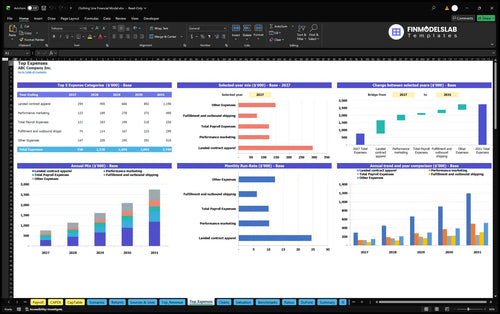
Largest costs and spending trends.

Annual and monthly financial performance.
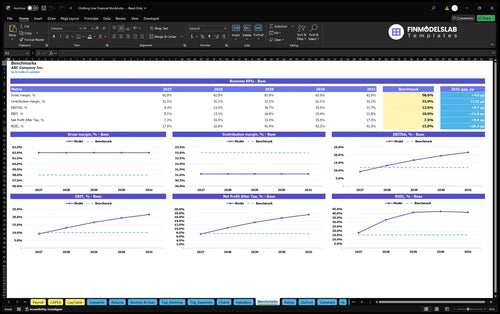
Compare margins and returns to benchmarks.

I stopped jumping between separate spreadsheets and charts. The model pulled everything into one place, and I saved about 4 hours on monthly reporting prep.

Switching between low, base, and high cases was a mess before. Now I can compare each scenario in minutes and get to a planning call the same day.
Pricing, cost, and growth inputs finally feel ordered instead of buried. I cleaned up our assumptions in one sitting and had a clearer budget discussion with my team.