

Revenue & Calc
Edit active accounts, monthly ordering frequency, cases per order, six category shares, and annual case prices. Monthly calculations apply launch timing and consolidate the resulting product-category revenue.


The Food Distribution Financial Model is an Excel financial planning template for a regional B2B food wholesaler. It converts active customer accounts, repeat orders, cases per order, category mix, and case prices into monthly revenue and a five-year operating forecast.
Its illustrative Dallas–Fort Worth case serves independent restaurants and small grocery stores from a leased 6,000-square-foot warehouse with cold storage and refrigerated delivery trucks. The forecast covers 2026–2030 in nominal US dollars; the example is not an industry average or a promised outcome.
The workbook links food-wholesale operating assumptions to monthly financial schedules, financing controls, and management reports.
Edit active accounts, monthly ordering frequency, cases per order, six category shares, and annual case prices. Monthly calculations apply launch timing and consolidate the resulting product-category revenue.
Plan food purchasing, shrinkage, freight, delivery costs, warehouse expenses, and staffing. Separate payroll schedules track annual-average FTE, role compensation, and personnel expenses.
Schedule refrigerated trucks, cold rooms, warehouse equipment, and equity contributions. Working-capital assumptions and funding schedules connect investment planning to the financial statements.
Review projected income, cash receipts and payments, and balance-sheet balances. The three statements address different questions, so operating EBITDA is not treated as available cash.
Select the forecast calendar, working-capital days, and Low, Base, or High case. Debt controls allow optional financing without assuming outside borrowing.
The revenue forecast multiplies average active B2B accounts by repeat orders and cases per order, then allocates cases across six food categories.
In the 2026 example, 60 active accounts each place six orders per month, with 25 cases per order. This produces 9,000 monthly cases, without a separate editable truck-capacity restriction on sales.
The selected case mix is fresh produce 25%, meat and poultry 20%, dairy and eggs 15%, frozen foods 15%, dry grocery 15%, and beverages 10%. Each category has its own annual blended case price.
The Revenue Forecast translates account demand, case mix, and category-specific prices into annual sales by product group. Its inputs flow into the Calc sheet for month-by-month projections after the January 31, 2026 launch date.
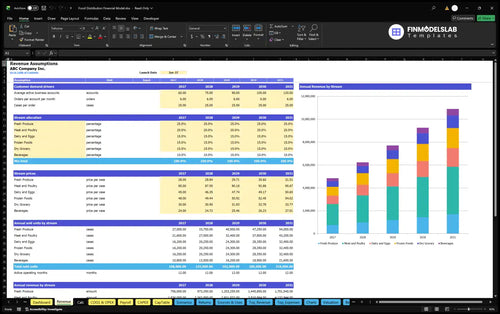
60 active accounts × 6 orders per month × 25 cases per order = 9,000 cases per month.
Using the six selected 2026 case prices, the volume-weighted price is $44.85 per case. That implies $403,650 in monthly sales and $4,843,800 for twelve active forecast months.
Average accounts increase to 120 by 2030, while the order cadence stays at six monthly orders and 25 cases each. Category price assumptions also rise annually; these inputs drive the illustrated growth in revenue.
The model separates food inventory and inbound costs, revenue-linked delivery expenses, monthly overhead, and fixed base salaries.
Direct costs use 82% of revenue for food bought for resale, 1.2% for spoilage and write-offs, and 0.6% for inbound freight. Together, the selected COGS assumptions equal 83.8% of sales.
Delivery fuel, handling materials, payment and collection fees, bad debt, and trade promotions form an additional 2.2% of revenue. Warehouse occupancy, refrigeration utilities, vehicle maintenance, insurance, software, and food-safety costs sit in monthly fixed expenses.
The COGS and Operating Expense Forecast organizes resale purchasing, inventory losses, inbound freight, revenue-based distribution expenses, and recurring warehouse overhead. It lets users see how these expense inputs affect operating margins without folding payroll into those categories.

The warehouse lease starts at $7,000 per month in 2026 and is entered for twelve paid months. Total fixed expenses in the example rise from $182,400 in 2026 to $234,093 by 2030.
The Payroll Forecast tracks delivery drivers, warehouse pickers, an owner-operations manager, a buyer, a sales representative, and a bookkeeper by FTE and salary. The example grows from 6.25 annual-average FTE in 2026 to 9.5 in 2030.
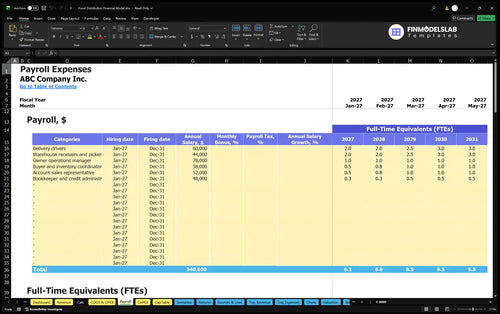
Opening asset purchases and prelaunch funding are modeled separately from annual food-distribution operating expenses.
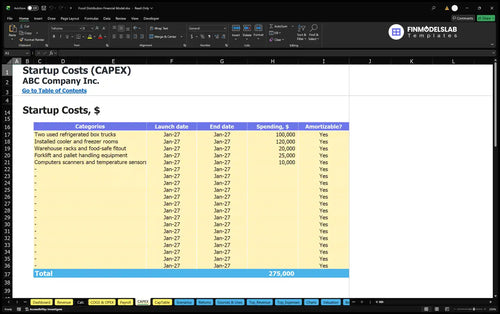
The startup schedule includes two used refrigerated box trucks at $100,000, installed cooler and freezer rooms at $120,000, warehouse racks and fitout at $20,000, and material-handling equipment at $25,000. Computers, scanners, and temperature sensors are additional assets.
The Capital Expenditure Plan schedules investment purchases and distinguishes depreciable assets from other spending. For this example, refrigerated trucks, cold storage, and warehouse equipment are opening investments rather than recurring food-purchase costs.
Separate startup cash covers the refundable warehouse deposit, opening marketing and permits, and preopening labor. Working-capital controls use 15 receivable days, 15 payable days, and 10 inventory days to frame collections, supplier payments, and stock funding.
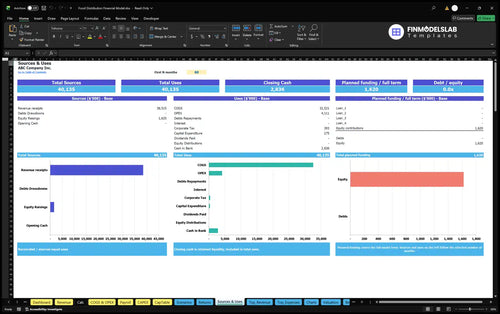
Estimated initial owner funding is $1,620,121, based on startup assets, other opening cash, opening net working capital, and a three-month recurring reserve. No committed outside financing is included in the selected case.
The Sources and Uses of Funds report explains where modeled money comes from and how it is allocated to operations, investment, financing, and retained cash. It helps reconcile planned owner funding against opening and subsequent cash requirements.
The selected 2026–2030 case projects annual revenue, operating expenses, and EBITDA in US dollars.
| Year | Revenue | Operating Expenses | EBITDA |
|---|---|---|---|
| 2026 | $4,843,800 | $4,701,068 | $142,732 |
| 2027 | $6,236,393 | $5,931,670 | $304,723 |
| 2028 | $7,708,446 | $7,309,172 | $399,274 |
| 2029 | $9,262,701 | $8,718,037 | $544,665 |
| 2030 | $10,903,356 | $10,134,979 | $768,377 |
Illustrative model outputs rounded to whole dollars; individual displayed values can differ by $1 when reconciled.
In the selected case, EBITDA increases from $142,732 in 2026 to $768,377 in 2030 as account volume and case prices increase. This is operating earnings before interest, taxes, depreciation, and amortization, not net profit or cash balance.
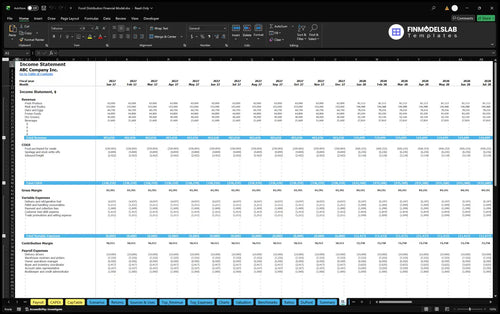
The Projected Income Statement connects monthly revenue, direct costs, variable expenses, payroll, and fixed expenses to margins and EBITDA. Its extended accounting lines can show depreciation, interest, taxes, and net profit when those underlying inputs are completed.
A wholesale business may report positive operating earnings while cash remains tied up in customer invoices or stock. The 15-day receivable, 15-day payable, and 10-day inventory settings therefore deserve separate review alongside planned purchases and equity funding.
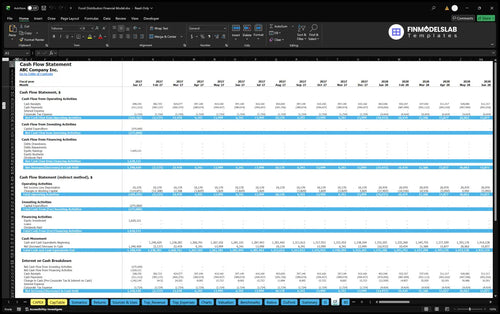
The Cash Flow Forecast traces cash receipts, operating payments, asset purchases, and financing flows through opening and closing balances. It is the relevant report for testing liquidity, rather than interpreting projected EBITDA as cash available for distribution.
Returns and scenario reports help test whether the selected operating assumptions support the business goals, without presuming a specific investment return.
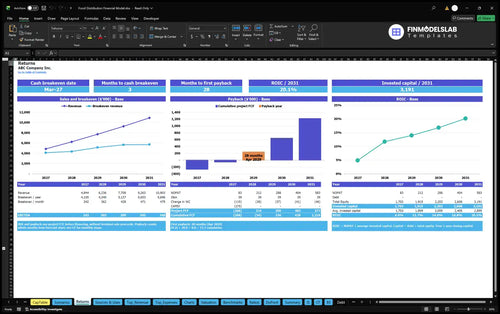
Sales break-even compares revenue with the level needed to cover modeled operating costs; cash break-even considers the timing of actual cash flows. Investment payback measures recovery of invested funds, while annual ROIC evaluates returns relative to invested capital.
The Break-Even, Payback and ROIC report brings together operating break-even, cash break-even, project investment payback, and annual return-on-invested-capital measures. These are different indicators and cannot be calculated from EBITDA alone.
On the Dashboard, Low, Base, and High multipliers can vary revenue, COGS, variable expenses, fixed expenses, and payroll. For a food distributor, this can help examine lower account demand, changes in procurement costs, or higher warehouse overhead.
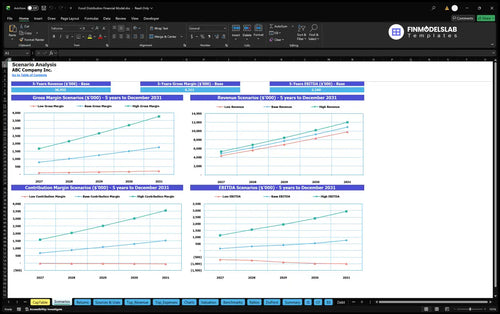
The Financial Scenario Analysis compares Low, Base, and High projected revenue, gross margin, contribution margin, and EBITDA. It helps assess how changes in sales and cost assumptions flow through the operating model before financing decisions are made.
Answers to common questions about the editable assumptions, operating outputs, and finance reports.
Active B2B accounts multiply by orders per account and cases per order. Cases are allocated to six food categories and multiplied by their blended prices.
Yes. The Revenue sheet holds category mixes and annual prices, and Calc uses them with ordering demand to produce monthly revenue.
No. This selected revenue engine is demand based; vehicles and staff affect supporting costs rather than creating an additional editable revenue-capacity ceiling.
Yes. CAPEX, CapTable, working-capital inputs, Cash Flow, and Sources & Uses support funding analysis. The supplied example does not establish that cash is sufficient.
No. EBITDA excludes accounting items below operating earnings and is distinct from cash flow, debt service, capital spending, and distributions.
The Returns report includes break-even, cash break-even, investment payback, and annual ROIC analyses. No specific payback result is asserted for the example.
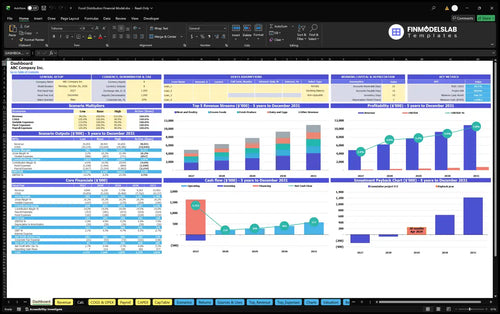
KPIs, forecasts, and cash flow at a glance.
Key assumptions and calculations driving revenue forecasts.
Funding sources, spending, and closing cash.
Cash break-even, payback, and ROIC.
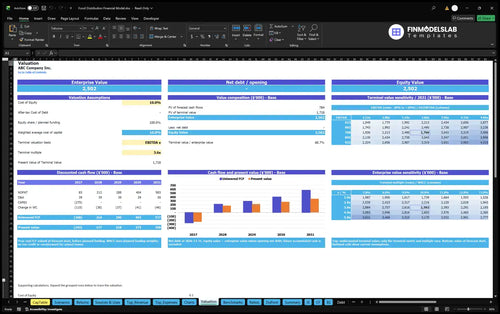
DCF valuation and sensitivity analysis.
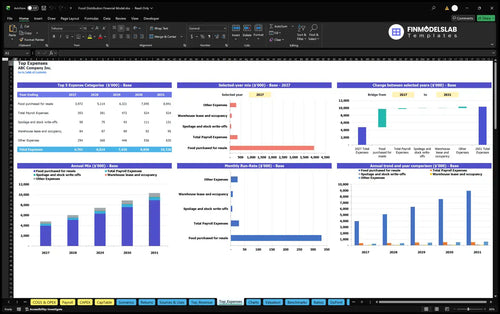
Largest costs and spending trends.

Annual and monthly financial performance.
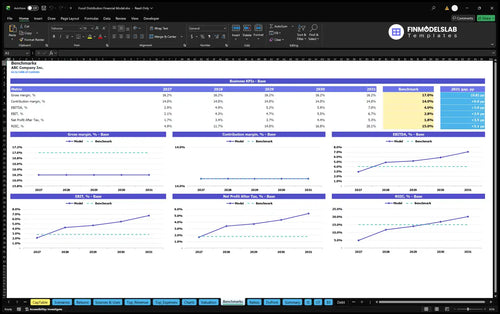
Compare margins and returns to benchmarks.

The margin and break-even tabs made profitability easy to read, and I saved about 6 hours I would have spent rebuilding the numbers myself. It gave me a cleaner view of where the business starts to work.

I finally had a model that showed the outputs investors expect, so I could share it in one meeting instead of sending follow-up explanations for days. The layout made my assumptions look organized and easy to defend.
The cash-flow forecast made runway and shortfalls much easier to track, and it saved me from guessing month to month. I could spot the pressure points early and plan financing with a lot more confidence.