

Revenue & Calc
Set visits, conversion, items per purchase, merchandise mix, prices and launch timing. Monthly calculations turn this demand into department sales and annual revenue.


The Gift Shop Financial Model is an Excel template for projecting merchandise revenue, operating expenses and EBITDA from 2026 through 2030. Edit store traffic, purchase conversion, basket size, department prices, staffing and costs to evaluate an independent gift shop.
The illustrative case covers one leased, 1,000-square-foot U.S. store selling nonfood tangible gifts at consumer checkout, with an owner-manager and sales associates. It assumes six selling days per week and eight-hour days, without custom manufacturing or delivery.
The workbook connects editable retail assumptions with monthly calculations, financial statements and decision reports.
Set visits, conversion, items per purchase, merchandise mix, prices and launch timing. Monthly calculations turn this demand into department sales and annual revenue.
Separate merchandise and selling costs from overhead and role-based staffing. Adjust revenue-linked rates, monthly fixed costs and annual-average FTE without counting salaries twice.
Schedule shop assets, owner contributions and financing. Dashboard debt controls feed four facility schedules with drawdowns, principal, interest and balances.
Use IS, CF and BS to review profitability, cash movement and financial position. Dashboard, Scenarios and Returns help assess operating changes and investment requirements.
One demand-based calculation produces sold items, which the model allocates once across six merchandise departments.
Daily visits rise from 62 in 2026 to 92 in 2030, while purchase conversion increases from 40% to 44%. Each purchase contains 1.5 items; the model uses 26 open days per month and has no separate capacity limiter.
Monthly seasonality adjusts the common item pool before category revenue is calculated. The January–December multipliers total 12.00, including 0.65 in January and 2.05 in December; January 2026 is a full launch month despite the January 31 launch date.
The Revenue Forecast connects visits, conversion, item counts, department mix and net selling prices to category sales. Local souvenirs receive the residual 12% share after the other five departments, keeping total unit allocation at 100%.
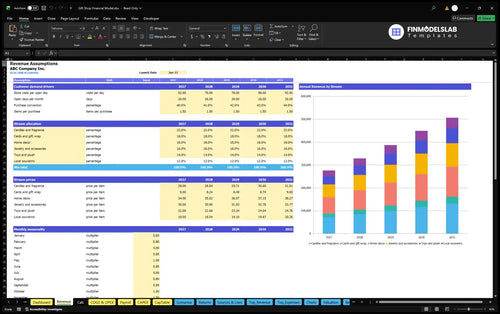
| Department | Unit Mix | Net Price per Item |
|---|---|---|
| Candles and fragrance | 22% | $28.00 |
| Cards and gift wrap | 18% | $8.00 |
| Home decor | 18% | $34.00 |
| Jewelry and accessories | 16% | $30.00 |
| Toys and plush | 14% | $22.00 |
| Local souvenirs | 12% | $18.00 |
Estimated planning inputs; department prices increase across the forecast.
62 visits/day × 26 days/month × 40% conversion × 1.5 items/purchase × 12.00 total seasonality = 11,606.4 projected items.
The 2026 mix produces a weighted net selling price of $23.76 per item, giving approximately $275,768 in annual revenue. Change traffic, conversion, mix or prices to test the sales assumptions behind your own store plan.
Revenue-linked COGS and variable expenses total 60% of sales before fixed overhead and payroll in the illustrative case.
The COGS & Operating Expense Forecast organizes direct, variable and fixed spending. Merchandise purchases, inbound freight and shrinkage equal 50%, 2% and 1.5% of revenue; card processing, recurring promotions and checkout packaging add 3%, 2.5% and 1%, respectively.
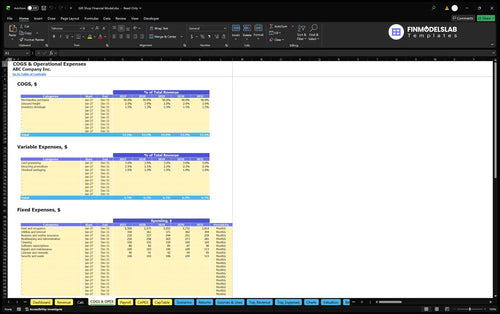
Fixed expenses total $45,600 in 2026 and $51,323 in 2030, covering occupancy, utilities, insurance, administration, cleaning, software, maintenance, licenses, security and waste. Rent starts at $2,500 per month for 12 paid months; salaries remain outside these expense categories.
The Payroll Forecast calculates personnel expenses from staffing and compensation inputs by role. The case retains one manager and increases annual-average associate staffing from 0.85 to 1.3 FTE, taking annual base payroll from $77,750 to $93,500.
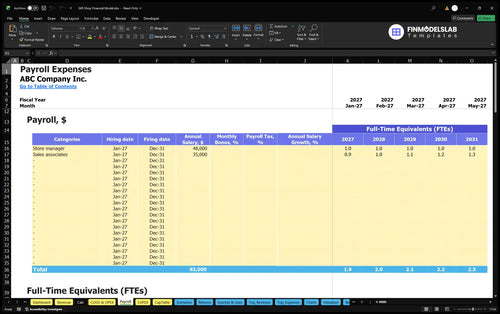
| Role | 2026 FTE | 2030 FTE | Annual Base per FTE |
|---|---|---|---|
| Store manager | 1 | 1 | $48,000 |
| Sales associates | 0.85 | 1.3 | $35,000 |
FTE represents annual-average staffing, not necessarily individual employee headcount.
Startup assets, separate opening cash, working capital and a reserve determine the initial owner funding input.
Startup assets total $34,000: $18,000 for leasehold improvements, $12,000 for display fixtures, $2,500 for POS and security hardware, and $1,500 for stockroom equipment. Deposits, formation and initial permits, the opening campaign and preopening setup payments are separate startup cash items.
The Sources and Uses of Funds report reconciles funding sources and cash allocation over a selected period. Illustrative initial owner funding is $155,561, based on assets, other startup cash, opening net working capital and a three-month reserve, less committed non-owner funding.
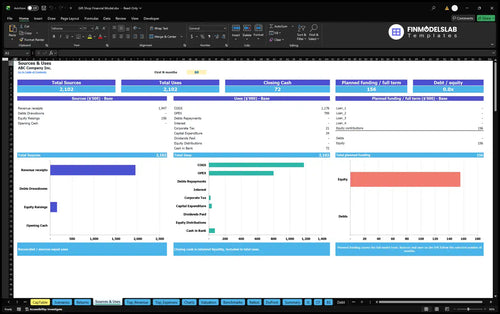
Working-capital controls assume zero receivable days, zero payable days and 90 inventory days. These timing inputs help assess the cash tied up in stock, but neither the reserve assumption nor positive EBITDA establishes that funding will cover every forecast cash requirement.
The documented gift shop case projects annual revenue, total operating expenses and EBITDA in U.S. dollars.
| Year | Revenue | Operating Expenses | EBITDA |
|---|---|---|---|
| 2026 | $275,768 | $288,811 | −$13,043 |
| 2027 | $328,709 | $327,193 | $1,516 |
| 2028 | $386,502 | $366,778 | $19,724 |
| 2029 | $449,332 | $409,428 | $39,905 |
| 2030 | $506,610 | $448,789 | $57,821 |
Illustrative projections, not historical results or industry averages; independently rounded amounts may differ slightly when subtracted.
Revenue grows as visits, conversion and department prices increase. EBITDA turns positive in 2027 at $1,516 and reaches $57,821 in 2030; the small 2027 surplus leaves limited room for adverse operating changes in this case.
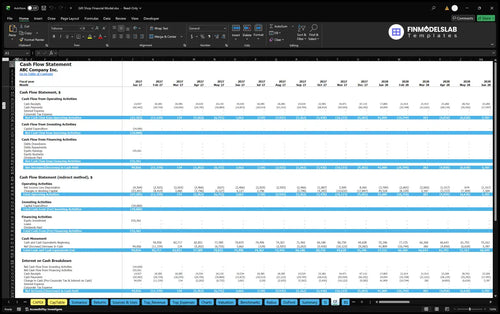
The Cash Flow Forecast tracks operating, investing and financing movements and reconciles opening and closing cash. Use it to examine inventory, startup spending and financing timing; the supplied operating case does not establish cash balances or tested liquidity.
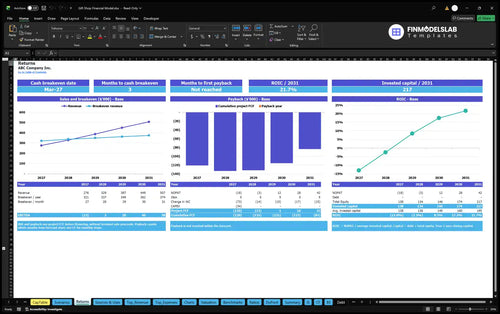
The Returns report provides distinct measures for operating cost coverage, cash timing, investment recovery and annual capital returns.
Dashboard Low, Base and High controls apply separate multipliers to revenue, COGS, variable expenses, fixed expenses and payroll. Compare resulting margins and EBITDA to test whether lower sales or higher staffing costs leave sufficient operating earnings under your assumptions.
The Return on Invested Capital Analysis separates sales break-even, cash break-even, investment payback and annual ROIC. Sales break-even tests operating cost coverage, cash break-even evaluates cash timing, payback tracks investment recovery, and ROIC relates annual operating returns to invested capital.
These answers clarify the editable inputs, intended operating format and limits of the illustrative forecast.
The case represents one independent U.S. physical store selling nonfood tangible gifts at checkout, without custom manufacturing or delivery; its regional cost assumptions do not represent a city-specific lease.
Edit daily visits, monthly open days, purchase conversion, items per purchase, monthly seasonality, merchandise mix, net selling prices and launch timing to build your own revenue forecast.
No; the documented calculation treats January 2026 as a full launch month, applies its seasonal multiplier and sets all streams to zero before the launch month.
No; the illustrated payroll includes the listed fixed base salaries and FTE assumptions, with employer taxes and benefits excluded under the case scope.
No; EBITDA measures operating earnings before interest, tax, depreciation and amortization, while investment payback depends on cash flows and invested funds shown in the separate Returns report.
No; the supplied values are estimated planning inputs, and the projected results are illustrative rather than observed gift shop performance or independently verified industry averages.
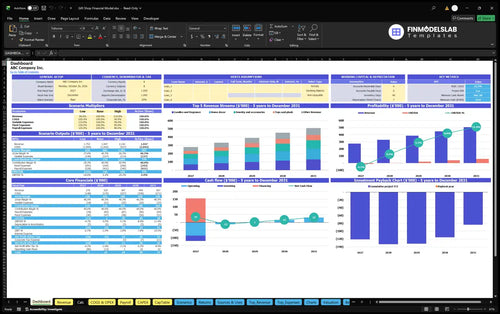
KPIs, forecasts, and cash flow at a glance.
Key assumptions and calculations driving revenue forecasts.
Funding sources, spending, and closing cash.
Cash break-even, payback, and ROIC.
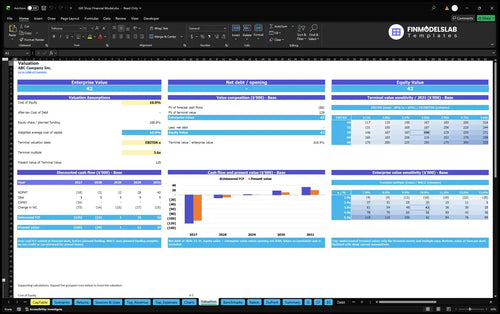
DCF valuation and sensitivity analysis.
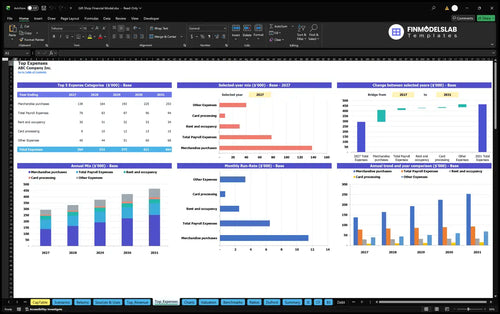
Largest costs and spending trends.
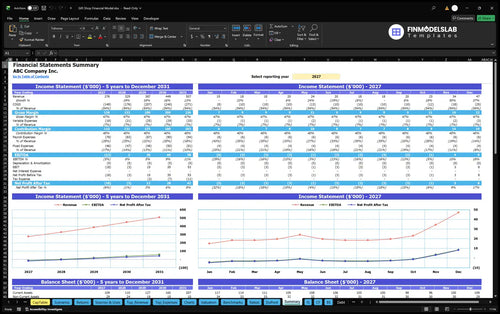
Annual and monthly financial performance.
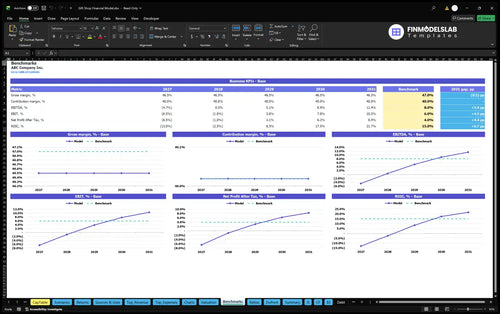
Compare margins and returns to benchmarks.

The low, base, and high cases were all laid out clearly, so I stopped wasting time comparing versions by hand. That saved me hours and made it easier to walk through the plan with my partner.
I’m not an Excel pro, and this template kept the formulas and tabs easy to follow. I built a clean forecast in one afternoon instead of spending days trying to figure out advanced modeling.

Pricing, costs, and growth inputs were all organized in one place, which made the whole model much easier to update. I booked a meeting with our accountant using numbers I could actually explain.