

Revenue and Calc
Enter seating capacity, service days, utilization, check prices, and guest mix. Calc builds monthly sales by basket.


This Small Restaurant Financial Model is an Excel template for a 36-seat restaurant in Raleigh, North Carolina. It connects guest capacity, check mix, operating costs, staffing, and opening investment to monthly financial projections for 2026 through 2030.
The example serves lunch and dinner without alcohol, delivery, or catering. Its five revenue baskets are mutually exclusive guest checks; sales exclude taxes and tips. The January 31, 2026 launch date and projections are planning assumptions, not observed operating results.
The workbook connects restaurant-specific planning inputs with monthly schedules, financial statements, scenario controls, and investment analysis.
Enter seating capacity, service days, utilization, check prices, and guest mix. Calc builds monthly sales by basket.
Separate ingredients, revenue-linked fees, overhead, and role-based salaries to forecast operating costs.
IS, CF, and BS report accounting profit, cash movements, assets, liabilities, and balance checks beyond EBITDA.
CAPEX schedules asset investment and depreciation; CapTable tracks equity and Debt calculates financing facilities when entered.
Dashboard, Scenarios, Returns, Sources & Uses, Valuation, and Checks support scenario comparisons, funding review, and validation.
One pool of 36 dining seats generates guest visits, which the model allocates across five non-overlapping lunch and dinner check baskets.
The 2026 case allows three guest visits per seat daily, 26 service days monthly, and 50% utilization. Annual utilization rises to 58%, 65%, 70%, and 72% through 2030.
Check baskets include light lunch, lunch main and drink, casual dinner, two-course dinner, and premium dinner. Shares are 15%, 20%, 30%, 25%, and a calculated remaining 10%.
The Revenue Forecast links seat capacity, utilization, service days, check prices, and basket shares. Monthly visits and check revenue feed annual restaurant sales.
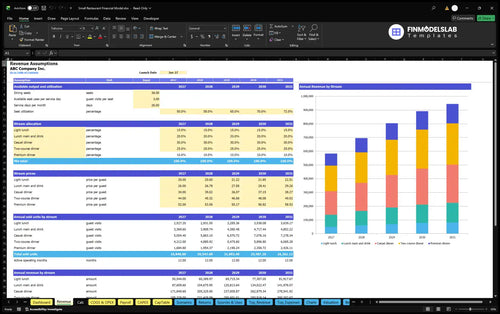
36 seats × 3 guest visits per seat × 26 days × 50% utilization = 1,404 checks; 1,404 × $34.60 weighted check ≈ $48,578 revenue.
The weighted 2026 check applies guest shares to prices of $20, $26, $34, $44, and $52. Increasing annual prices and utilization let users test check growth and visit volume separately.
Each guest belongs to one basket, so lunch and dinner do not double-count seats. Change utilization, prices, or mix to examine sales sensitivity.
The restaurant calculates direct ingredients, revenue-based expenses, monthly overhead, and fixed base salaries separately before arriving at operating EBITDA.
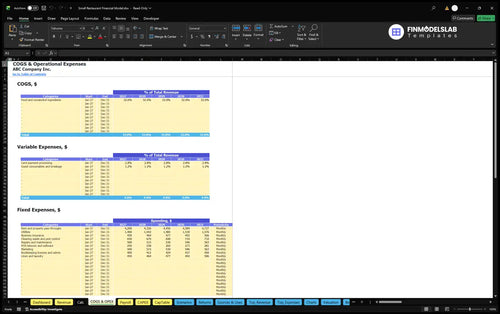
Ingredients equal 32% of sales. Card processing at 2.8% and consumables or breakage at 1.2% are variable expenses, separate from COGS.
Fixed costs cover rent, utilities, insurance, cleaning, repairs, POS, marketing, administration, and laundry. Monthly rent grows from $4,200 in 2026 to approximately $4,727 in 2030, paid for 12 months annually.
The COGS and Operating Expenses forecast separates food ingredients, sales-linked charges, and recurring overhead. Adjust cost rates to evaluate margin sensitivity as revenue changes.
| Expense group | 2026 | 2030 |
|---|---|---|
| Ingredient COGS | $186,541 | $302,332 |
| Variable expenses | $23,318 | $37,792 |
| Fixed overhead | $105,600 | $118,854 |
| Payroll | $247,000 | $247,000 |
Amounts are rounded to whole dollars; payroll is excluded from the other three groups.
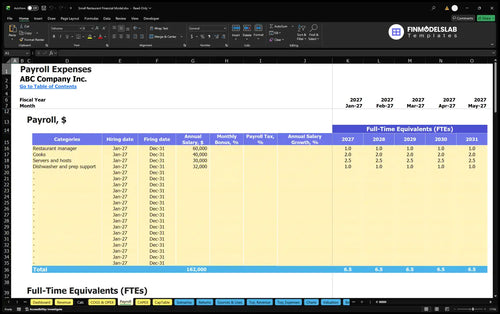
The Payroll Forecast covers a manager, two cooks, 2.5 server and host FTE, and one dishwasher or prep FTE. Together, 6.5 FTE receive $247,000 in annual base salaries, excluding other expense categories.
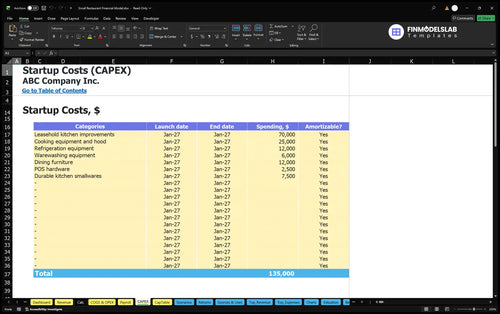
Startup assets, one-time opening cash, working capital, and owner equity are planned separately from recurring restaurant operating expenses.
Opening assets include $70,000 kitchen improvements, $25,000 cooking equipment and hood, $12,000 refrigeration, and $6,000 warewashing. Furniture, POS hardware, and durable kitchen smallwares are also planned.
One-time cash needs include lease deposits, permits, setup, launch marketing, preopening wages, prepaid insurance, and utility deposits. These items are distinct from recurring operating expenses.
The Capital Expenditure Plan schedules asset purchases and depreciation. Its kitchen and dining investments feed asset reporting, rather than being treated as routine food or payroll expenses.
The case has $306,493 in estimated owner funding, including a three-month operating cash reserve. Receivables are zero days, payables seven days, and inventory five days; no uncommitted external financing is assumed.
The Sources and Uses of Funds report compares operating receipts, owner equity, and entered debt with expenses, investment, financing payments, and retained cash. Equity is funding, not restaurant revenue.
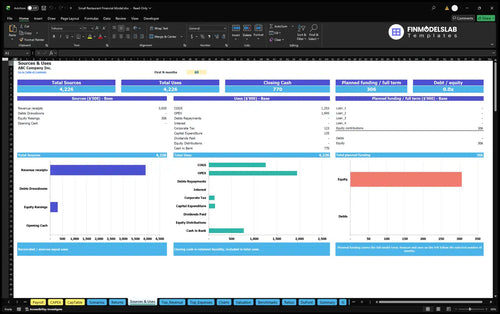
The example produces increasing annual revenue and operating EBITDA as utilization and guest-check prices rise across the 2026–2030 Raleigh restaurant case.
| Year | Revenue | Operating expenses | EBITDA |
|---|---|---|---|
| 2026 | $582,941 | $562,459 | $20,482 |
| 2027 | $696,498 | $606,507 | $89,991 |
| 2028 | $803,971 | $648,461 | $155,511 |
| 2029 | $891,749 | $683,422 | $208,328 |
| 2030 | $944,789 | $705,978 | $238,811 |
Illustrative projections, not observed results or industry averages. Display rounding may cause small differences in subtraction.
EBITDA rises from $20,482 in 2026 to $238,811 in 2030; modeled margins rise from about 3.5% to 25.3%. Base payroll remains $247,000 annually as visits, check prices, and some overhead increase.
EBITDA excludes depreciation, interest, and taxes. The Income Statement supports further accounting projections, but this case supplies no numeric net profit or borrowing result.
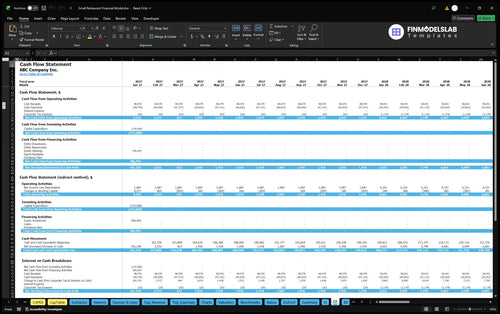
The Cash Flow Forecast separates operating receipts, expenses, investment, and financing cash movements. Monthly cash reconciliation helps examine liquidity amid inventory, payables, and opening funding requirements.
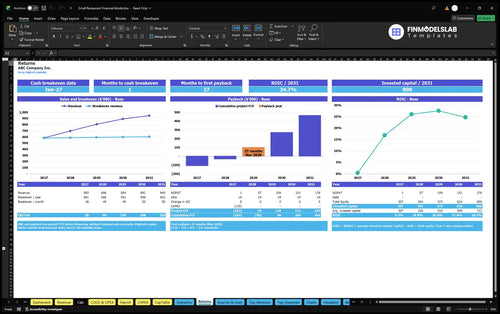
Returns and scenario tools help compare the sales level needed to cover costs with cash recovery and capital-efficiency questions.
Sales break-even tests revenue against operating costs; cash break-even tests cash timing. Investment payback examines recovery of project outlays, while annual ROIC measures returns on invested capital.
The Returns report calculates break-even, project payback, and annual ROIC from supporting cash-flow and capital schedules. No specific payback date or ROIC result is established here.
Dashboard Low, Base, and High multipliers adjust revenue, COGS, variable costs, fixed expenses, and payroll for sensitivity comparisons.
Debt and Valuation can model entered financing terms and discounted cash flow; no approved loan, verified valuation, or realized investor return is implied.
Use this template for a mainly dine-in restaurant with shared seating and complete guest checks.
Test seat utilization, check mix, prices, staffing, occupancy costs, and opening cash. Raleigh inputs are editable estimates, not certified local benchmarks.
Alcohol, delivery, catering, or separately constrained service channels need revenue-design changes beyond this dine-in example.
Key scope, calculation, reporting, and funding questions for evaluating the Excel restaurant model.
Yes. Change seats, guest visits per seat, service days, and utilization to recalculate revenue.
No. Each visit belongs to one of five exclusive baskets within a shared seating pool.
No. The case includes dine-in lunch and dinner only.
COGS, processing, consumables, overhead, and base payroll are included once; depreciation, interest, taxes, and employer benefits are excluded.
Estimated owner equity covers opening assets, working capital, one-time needs, and a three-month cash reserve—not revenue.
Yes. It includes income, cash flow, and balance sheet reports; example figures stop at EBITDA.
No. Returns supports these measures, but the case establishes no specific payback or ROIC result.
Yes. Dashboard Low, Base, and High controls compare revenue, costs, and profitability.
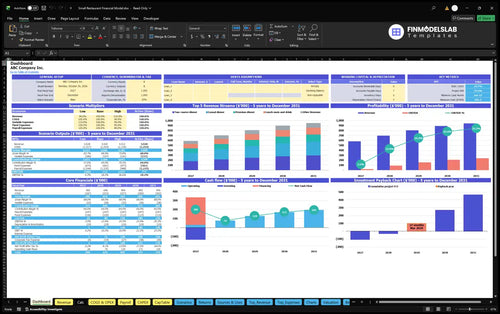
KPIs, forecasts, and cash flow at a glance.
Key assumptions and calculations driving revenue forecasts.
Funding sources, spending, and closing cash.
Cash break-even, payback, and ROIC.
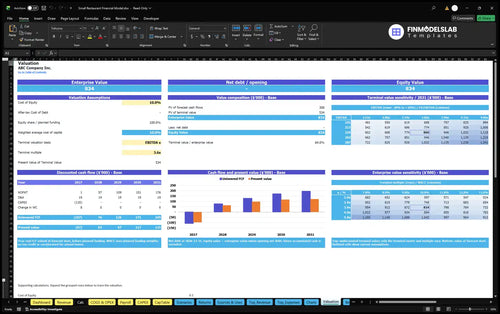
DCF valuation and sensitivity analysis.
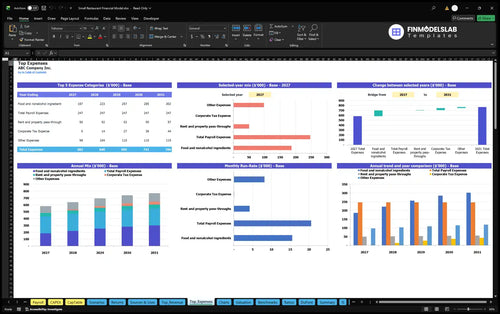
Largest costs and spending trends.
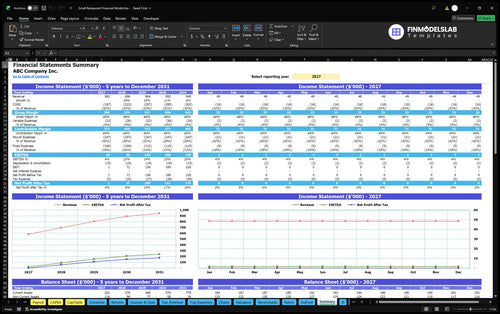
Annual and monthly financial performance.
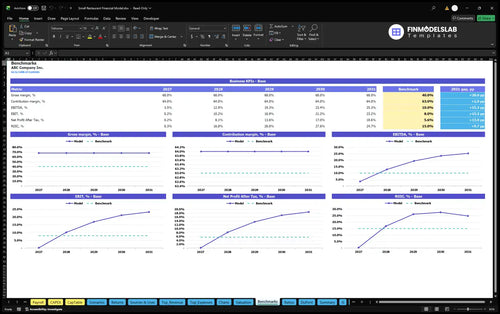
Compare margins and returns to benchmarks.

I was nervous one broken formula would throw off the whole model, but this template kept everything linked and easy to follow. It saved me a few hours of rechecking and made the numbers feel dependable.

I’m not great with advanced Excel, so I appreciated how the inputs and tabs were laid out. I had the forecast ready the same day without needing to hire anyone to clean it up.
The model made margins and break-even much easier to see, which helped us decide whether the location made sense. That clarity got our planning meeting booked and made the next steps obvious.